Issue Date: Monday, July 19, 2021
Issue Time: 9:35 AM MDT
Summary:
A high-pressure ridge in western Colorado limited storm development across much of the state yesterday, with the exception of the Southwest Slope, San Juan Mountains, and Southeast Plains.
Severe thunderstorms developed on the Southeast Plains near the I-70 corridor and Kansas state line in the early afternoon. Several severe thunderstorm warnings were issued as storms moved along in a general north to south motion – the largest severe threats being high winds and large, damaging hail, but the potential for heavy rain remained as well. These storms were also very slow moving, and many warning messages mentioned the cells as “nearly stationary.” Several large hail reports came in, ranging from 0.25-1.00 inches, and wind gusts up to 56 mph. Due to the rural location of these storms, there are limited observations, but some notable storm totals from CoCoRaHS observers include:
- 1.02 inches in Holly
- 0.64 inches in Cheyenne Wells
- 0.33 inches in Springfield
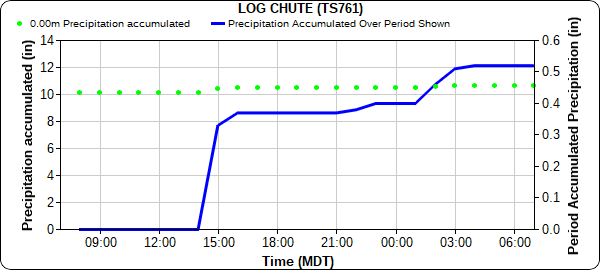
On the other side of the state, two pulses of thunderstorm activity fueled by monsoonal moisture brought moderate precipitation to the Southwest Slope and San Juan Mountains. The first round of thunderstorms began in the afternoon with a break in activity until late evening/overnight. Mancos and Durango each picked up around 0.45 inches, according to CoCoRaHS observers. The time series plot from Log Chute, north of Durango, shows the two periods of storm activity, with the first pulse observed at this location around 3:00 pm and then second after midnight.
Pagosa Springs received between 0.25-0.80 inches of precipitation as well. The gridded MetStorm Live precipitation totals, as seen in the State Precipitation Map below, have underestimated precipitation in southern San Juan Mountains yesterday. This is possibly because storm tops were fairly low and the far-away radars in Grand Junction and Albuquerque were scanning too high to accurately pick up rainfall intensity. For rainfall estimates in your area, including antecedent conditions, check out the SPM below!
Click Here For Map Overview

