SPM 08-07-2021: Windy and Smoky Day Across Colorado

Issue Date: Saturday, August 7th, 2021
Issue Time: 10:15 AM MDT

Summary:

Yesterday saw widespread storm coverage across much of Northern and Central Colorado, though limited available moisture resulted in little rainfall accumulation. Instead, strong thunderstorm and non-thunderstorm winds were the main threat. High winds were reported in Burlington (70mph) on the Eastern Plains all the way to Rangely (45 mph) on the Western Slope, with many high wind reports scattered in between. For the fires burning in the Northern Mountains, several rounds of thunderstorms brought wind gusts up to 40 mph, which exacerbated fire weather behavior. Thankfully, there were also minor rainfall accumulations between 0.05-0.20 inches, especially on the Morgan Creek fire to hinder fire advancement.

The Northern Mountains, and Northern Front Range Mountains in particular, received some notable precipitation yesterday. A flash flood warning was issued in the evening for Larimer County, including the Cameron Peak burn scar. A CoCoRaHS observer in Rustic reported up to 0.48 inches of precipitation, and a bit southeast in Glen Haven up to 0.64 inches were reported. No flooding or debris flows were reported yesterday as a result of heavy rain over the region.

Several locations along the Urban Corridor also received light precipitation, though not enough to register above to 0.25 inch threshold in the MetStormLive grids in the SPM. In addition to the windy day, smoke in the air and reduced air quality was the main concern for the Front Range and Urban Corridor. For rainfall estimates in your area, including antecedent conditions, check out the State Precipitation Map below.

Click Here For Map Overview

The map below shows radar-estimated, rainfall gage-adjusted Quantitative Precipitation Estimates (QPE) across Colorado. The map is updated daily during the operational season (May 1 – Sep 30) by 11AM. The following six layers are currently available: 24-hour, 48-hour and 72-hour total precipitation, as well as maximum 1-hour, 2-hour and 6-hour precipitation over the past 24 hour period (to estimate where flash flooding may have occurred). The accumulation ending time is 7AM of the date shown in the bottom right corner. Also shown optionally are vulnerable fire burn areas (post 2012), which are updated throughout the season to include new, vulnerable burn areas. The home button in the top left corner resets the map to the original zoom.

SPM 08-06-2021: Widely Scattered Storms – Drought Monitor Update

Issue Date: Friday, August 6th, 2021
Issue Time: 9:50 AM MDT

Summary:

A much dryer day yesterday with some widely scattered afternoon storms on the Southwest Slope, San Juan Mountains, and Front Range Mountains. Precipitation totals were meager compared to what has been seen lately, Trace-0.11 inches. Then late evening into the night, storms developed on the Northeast Plains, again with low precipitation totals, less than 0.1 inches. The bigger weather story of the day was the increased some in the air from fires burning across the west, reducing air quality and visibility.

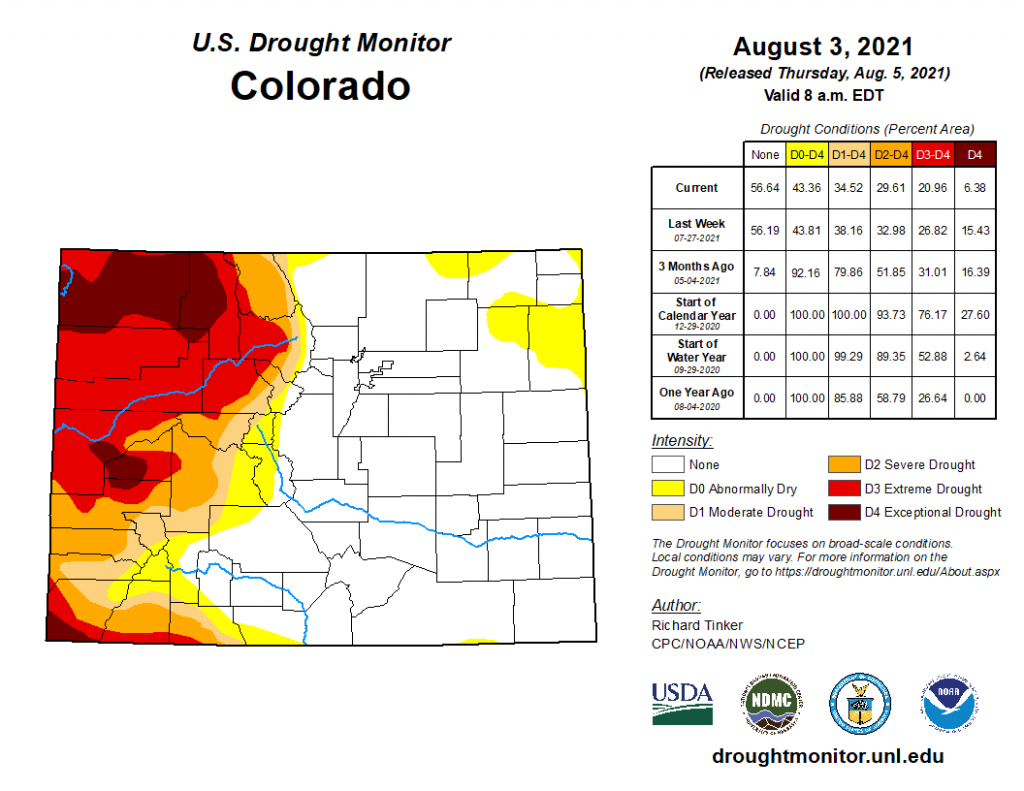
The latest drought monitor for Colorado was released yesterday (map below), reflecting conditions as of Tuesday, August 3rd. Several weeks of monsoonal moisture have not been enough to completely help Western Colorado’s Drought, but there have been improvements. The total area experiencing D4 “Exceptional Drought” has reduced by over half, especially on the Northwest Slope, and there have been improvements in regions experiencing D1-D3 drought as well. Most of the San Juan Mountains is no longer experiencing any drought conditions, which is a huge improvement from even 3 months ago. Conversely, dryer than normal weather in the Northeast Plains have led to some regions moving into D0 “Abnormally Dry” conditions.

For rainfall estimates in your area, check out the State Precipitation Map below.

Click Here For Map Overview

The map below shows radar-estimated, rainfall gage-adjusted Quantitative Precipitation Estimates (QPE) across Colorado. The map is updated daily during the operational season (May 1 – Sep 30) by 11AM. The following six layers are currently available: 24-hour, 48-hour and 72-hour total precipitation, as well as maximum 1-hour, 2-hour and 6-hour precipitation over the past 24 hour period (to estimate where flash flooding may have occurred). The accumulation ending time is 7AM of the date shown in the bottom right corner. Also shown optionally are vulnerable fire burn areas (post 2012), which are updated throughout the season to include new, vulnerable burn areas. The home button in the top left corner resets the map to the original zoom.

SPM 08-05-2021: Storms in Southeast Plains, Street Flooding in Lamar

Issue Date: Thursday, August 5th, 2021
Issue Time: 9:50 AM MDT

Summary:

Another early start to precipitation yesterday, this time east of the divide and on the Eastern Plains and Palmer Ridge due to the slow-moving eastward progress of the upper-level trough. As the afternoon progressed, daytime heating allowed for greater convective storms to develop, with higher rainfall rates across the Southeast Plains.

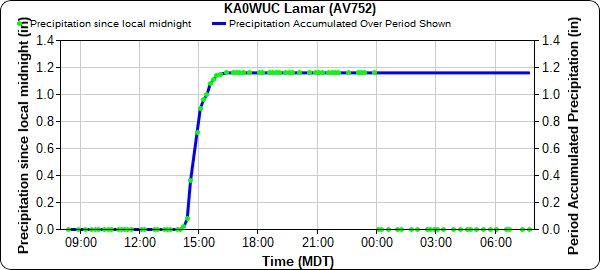
Lamar in the Southeast Plains experienced heavy rain and flooding associated with these storms yesterday afternoon. Several precipitation reports exceeded 1 inch, including 1.16 from a APRSWXNET/CWOP station, 1.14 from a CoCoRaHS observer, and 1.22 from a public report to law enforcement. Flash flood warnings were issued for both the City of Lamar and John Martin Reservoir yesterday.

Some notable flood reports mention “water in ditches everywhere” and “flooding at intersection of Main Street and Olive Street”. The water in the streets was deep enough to require traffic redirection from law enforcement. The following video shared by Weather Nation on twitter shows some of the deep water in town.

According to the APRSWXNET/CWOP station, all of the precipitation that fell yesterday came in a 2-hour window (time series plot below). Precipitation Frequency estimates from NOAA Atlas 14 for Lamar indicate the 1-year, 2-hour Average Recurrence Interval precipitation is 1.14. So while flooding did occur as a result of heavy rain, this amount of rain is expected to occur at least once a year in this portion of the state.

On the western half of the state, including the Front Range Mountains and Urban Corridor, dry air filled in behind the exit of the trough, leaving behind more seasonably warm temperature and limited precipitation. Within the air mass, increased smoke and pollutants from fire burning across the Western US reduced air quality.

For rainfall estimates in your area, check out the State Precipitation Map below.
Click Here For Map Overview

The map below shows radar-estimated, rainfall gage-adjusted Quantitative Precipitation Estimates (QPE) across Colorado. The map is updated daily during the operational season (May 1 – Sep 30) by 11AM. The following six layers are currently available: 24-hour, 48-hour and 72-hour total precipitation, as well as maximum 1-hour, 2-hour and 6-hour precipitation over the past 24 hour period (to estimate where flash flooding may have occurred). The accumulation ending time is 7AM of the date shown in the bottom right corner. Also shown optionally are vulnerable fire burn areas (post 2012), which are updated throughout the season to include new, vulnerable burn areas. The home button in the top left corner resets the map to the original zoom.

SPM 08-04-2021: Flooding Reported in Southwest Slope and Vulnerable Burn Scars

Issue Date: Wednesday, August 4th, 2021
Issue Time: 10:15 AM MDT

Summary:

There was an early start to the rainfall yesterday, especially in the Northern and Central Mountains. Flood advisories and flash flood warnings were issued across the state, including several fire burn scars. Cameron Peak, East Troublesome, Grizzly Creek, and Spring Creek have been especially vulnerable this year as they were recent fires, but Hayman-Teller, High Park, and Lake Christine burn scars also had heavy rain and flood warnings issued.

I-70 has remained closed after damaging debris flows this past weekend near the Grizzly Creek burn scar, and additional rain yesterday was likely unhelpful in the cleanup effort. Matt Minnillo shared the following screen grab of a CDOT road camera from yesterday which shows water flowing over the interstate again. Over an inch of rain fell near Dotsero yesterday.

CO125 was also closed yesterday north of Highway 40 along Grand and Jackson counties due to a mud flow adjacent to East Troublesome burn scar. A USGS gauge on East Troublesome Creek reported 0.39 inches yesterday. Even higher totals, between 0.64-1.24 inches, were reported just east of the slide around Lake Granby

In the southwest slope, flooding was reported in Placerville:
SAN MIGUEL SHERIFFS OFFICE REPORTS TWO MUDSLIDES ON HIGHWAY 145 AT MILE MARKERS 85 AND 86 JUST NORTH OF JUNCTION OF HIGHWAY 62 AND HIGHWAY 145. REPORTS OF 2 FEET OF DEBRIS ACROSS THE ROADWAY AT MILE MARKER 86.
A Weather Underground PWS in Placerville reported 1.35 inches of rain yesterday, with a peak rainfall rate over 4.5 inches per hour!

As the day progressed, storms spilled over onto Eastern Plains, aided by the passage of the slow-moving trough, resulting in the North-South orientation of rainfall across the state, seen in the map below. Some notable rainfall totals include:

  • 1.61 inches in Agate (Elbert County)
  • 1.58 inches in the Pinery (Douglas County), where a CoCoRaHS observer remarked that 1.49 inches of that fell in just an hour and half!
  • 1.52 inches in Franktown (Douglas County)
  • 1.15 inches in Byers (Arapahoe County)

For rainfall estimates in your area, check out the State Precipitation Map below.

Click Here For Map Overview

The map below shows radar-estimated, rainfall gage-adjusted Quantitative Precipitation Estimates (QPE) across Colorado. The map is updated daily during the operational season (May 1 – Sep 30) by 11AM. The following six layers are currently available: 24-hour, 48-hour and 72-hour total precipitation, as well as maximum 1-hour, 2-hour and 6-hour precipitation over the past 24 hour period (to estimate where flash flooding may have occurred). The accumulation ending time is 7AM of the date shown in the bottom right corner. Also shown optionally are vulnerable fire burn areas (post 2012), which are updated throughout the season to include new, vulnerable burn areas. The home button in the top left corner resets the map to the original zoom.