SPM 08-15-2021: Severe Thunderstorms on Eastern Plains

Issue Date: Sunday, August 15th, 2021
Issue Time: 9:25 AM MDT

Summary:

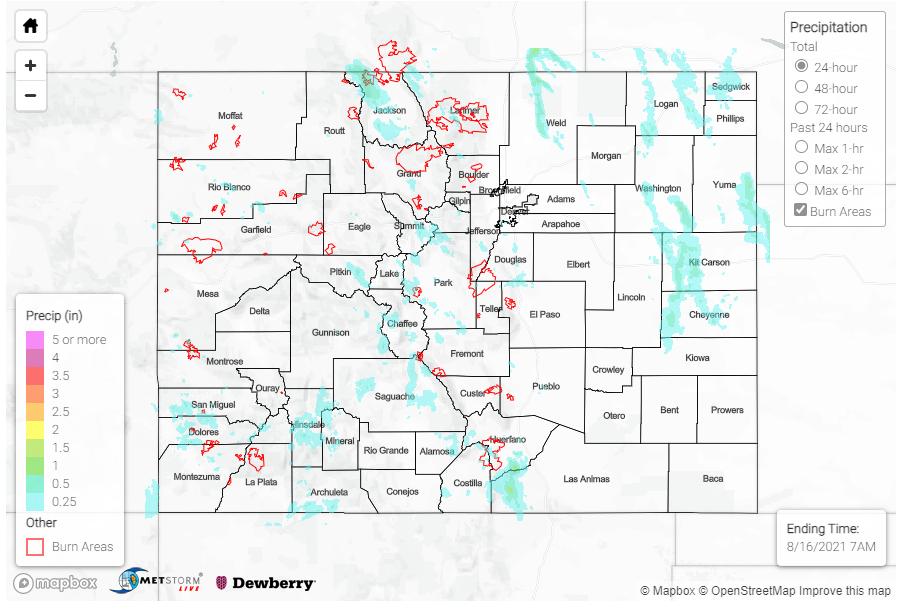
Saturday morning started with clear skies across much of the state and improved smoke conditions after a long string of days with poor air quality and haze. As the day progressed, isolated showers and storms began to fire in the high elevations, especially in the Northern and Central mountains. As afternoon turned to evening, storms filled in and became more widespread and organized in high elevations of the San Juan, Southeast, and Front Range Mountains, as well as spilling into the Southwest Slope and Northeast Plains as storms rotated around the high pressure traversing the state from west to east.

During all the action, the Cameron Peak (Northern and Front Range Mountains) and Spring Peak (Southeast Mountains) burn scars had flash flood warnings issued after Doppler radar indicated heavy rainfall. Portions of each scar received heavy rainfall, up to 0.5 inches, but thankfully no flooding was reported to have occurred at either burn scar.

By night, storms were moving southeast along the Urban Corridor and Northeast Plains. Much of the Denver metro area received light precipitation, and a cell between Castle Rock and Colorado Springs dropped up to 0.5 inches of rain. Linear storms on the northeast plains were strong enough for severe thunderstorms warnings along the Wyoming and Nebraska borders. An 0.88 inch hail report was made in Sedgewick by a CoCoRaHS observer, as well as many high wind reports along the Plains. Areas impacted by storms in the Northeast Plains received between 0.10 – 0.48 inches of rain as well.

Flooding was not reported on Saturday. For rainfall estimates in your area, check out the State Precipitation Map below.

Click Here For Map Overview

Note: The 24-hour, 48-hour and 72-hour total precipitation do not contain bias corrections today due to errors in the CoCoRaHS data. This means there may be underestimations in QPE over the southwest and southeast corners of the state.
The map below shows radar-estimated, rainfall gage-adjusted Quantitative Precipitation Estimates (QPE) across Colorado. The map is updated daily during the operational season (May 1 – Sep 30) by 11AM. The following six layers are currently available: 24-hour, 48-hour and 72-hour total precipitation, as well as maximum 1-hour, 2-hour and 6-hour precipitation over the past 24 hour period (to estimate where flash flooding may have occurred). The accumulation ending time is 7AM of the date shown in the bottom right corner. Also shown optionally are vulnerable fire burn areas (post 2012), which are updated throughout the season to include new, vulnerable burn areas. The home button in the top left corner resets the map to the original zoom.
SPM 08-14-2021: High Elevation Showers and Thunderstorms

Issue Date: Saturday, August 14th, 2021
Issue Time: 9:05 AM MDT

Summary:

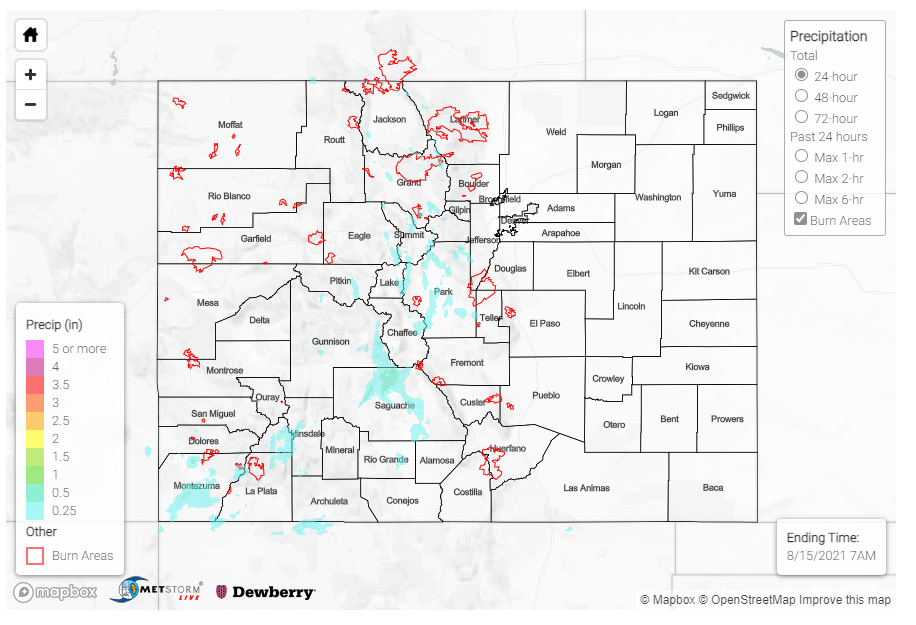
Moisture circling around the high-pressure ridge to the west brought southerly flow and early afternoon scattered thunderstorms to the high elevations of the Northern, Central, and San Juan mountains yesterday. As the afternoon progressed, showers spilled onto the Front Range Mountains and Urban Corridor, as well as filled in in the Southwest Slope.

The Southwest Slope benefited the most from the additional surge of monsoonal moisture. Between 0.25-0.78 inches were reported from various networks around Cortez and Mancos in Montezuma County. A bit to the northeast, a short-lived thunderstorm produced up to 0.34 inches of rain and small hail in Saguache. The CoCoRaHS observer left the following remark, indicating most of the rain fell in just half an hour:

Rain started as sprinkles about 4:50 p.m. About 4:55 it became heavy and lasted about 25 minutes. Hail (approximately 1/4 inch) started after the rain (about 5:10) and lasted for 5 minutes. The storm was over by 5:30. The temperature dropped 20 degrees from the storm–from 80 to 60 degrees

Flash flood warnings were issued for portions of the East Troublesome and Cameron Peak burn scars in the Northern and Front Range Mountains, but ultimately no flooding was reported. Rainfall accumulations were between 0.10-0.25 inches across each of the burn areas, which is just below the threshold for the State Precipitation Map below.

Yesterday also had the potential for severe weather on the Eastern Plains and Palmer Ridge, however there was too much stability to overcome and storms never materialized – to the disappointment of many who were hoping to chase, or at least get to see some excitement, near the Colorado-Wyoming border.

For rainfall estimates in your area, check out the State Precipitation Map below.

Click Here For Map Overview

Note: The 24-hour, 48-hour and 72-hour total precipitation do not contain bias corrections today due to errors in the CoCoRaHS data. This means there may be underestimations in QPE over the southwest and southeast corners of the state.
The map below shows radar-estimated, rainfall gage-adjusted Quantitative Precipitation Estimates (QPE) across Colorado. The map is updated daily during the operational season (May 1 – Sep 30) by 11AM. The following six layers are currently available: 24-hour, 48-hour and 72-hour total precipitation, as well as maximum 1-hour, 2-hour and 6-hour precipitation over the past 24 hour period (to estimate where flash flooding may have occurred). The accumulation ending time is 7AM of the date shown in the bottom right corner. Also shown optionally are vulnerable fire burn areas (post 2012), which are updated throughout the season to include new, vulnerable burn areas. The home button in the top left corner resets the map to the original zoom.
SPM 08-13-2021: Heavy Rain and Severe Storms in Urban Corridor, Palmer Ridge, and Eastern Plains

Issue Date: Friday, August 13th, 2021
Issue Time: 9:50 AM MDT

Summary:

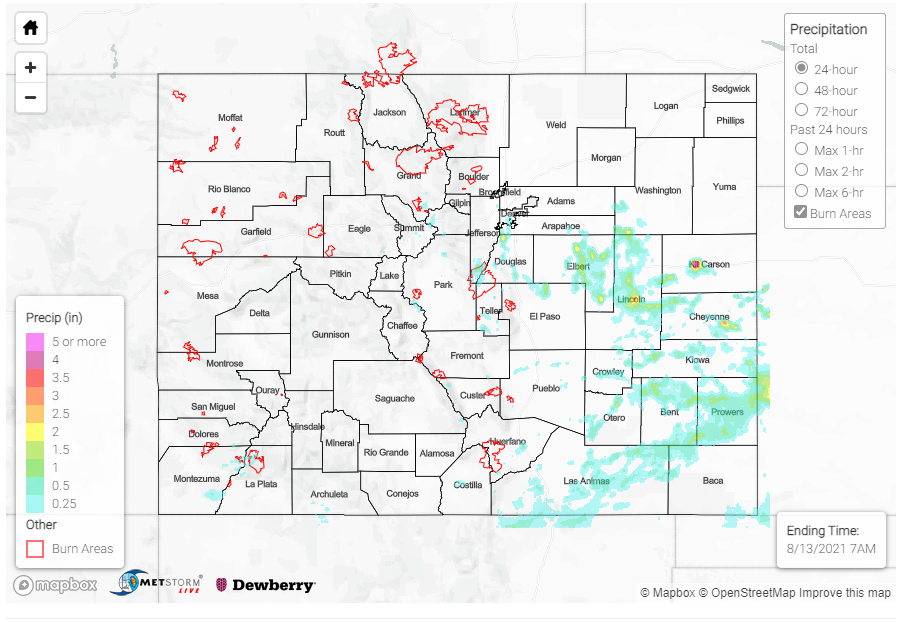
Thursday saw early afternoon storm development along an east-west oriented surface trough/disturbance in the Central and Front Range Mountains, extending along the Palmer Ridge and Southeast Plains. The disturbance had a general southern movement, allowing for storms to fire up along it as well as ahead of it along the Southeast Mountains and Raton Ridge. Severe thunderstorms warnings were issued, along with flash flood warnings, along the I-70 corridor on the Palmer Ridge and Southeast Plains, with the main threats including high winds, large hail, and localized heavy rainfall. Warnings verified with up to 60 mph winds reported in Cheyenne Wells, and up to 1.76 inch hail reported in Vona (Kit Carson County).

A personal weather station (PWS) and trained spotter also in Vona reported over 6 inches of rain yesterday in just 3-hours. The PWS rain gauge recorded 6.05 total, with the highest rainfall rate exceeding 11 inches/hour! Streets and sidewalks in downtown Vona were reported to be under water, as well as basement flooding and damage to some homes. There were no other heavy rain reports in the small town of Vona to verify the rainfall, but the un-bias corrected gridded QPE from MetStorm in the State Precipitation Map below corroborate the very large rainfall accumulation with a small areal footprint. If verified, 6.05 inches in 3-hours amounts to a 743-year rainfall event (or just 0.13% chance of occurrence in any given year), based on Precipitation Frequency Estimates (PFE) from NOAA Atlas 14.

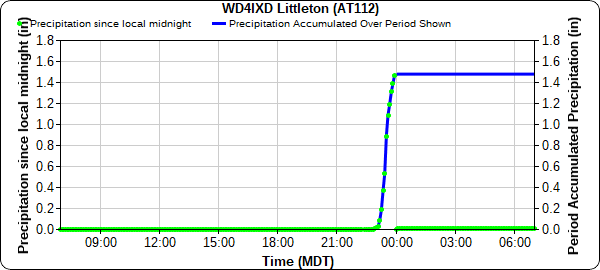
Later in the evening flash flood warnings were issued for the southern Denver suburbs in the Urban Corridor, as well as portions of the Hayman-Teller burn scar in the Front Range Mountains, Palmer Ridge and Eastern Plains. A late evening, almost stationary storm over the Urban Corridor produced over 1.5 inches in Littleton in a little over an hour after 11:00 pm, as seen in the time series plot below. PFEs for this area place the rainfall total between a 10 and 25-year average recurrence interval (or between 4-10% chance of occurrence in any given year).

For rainfall estimates in your area, check out the State Precipitation Map below!

Click Here For Map Overview

Note: The 24-hour, 48-hour and 72-hour total precipitation do not contain bias corrections today due to errors in the CoCoRaHS data. This means there may be underestimations in QPE over the southwest and southeast corners of the state.
The map below shows radar-estimated, rainfall gage-adjusted Quantitative Precipitation Estimates (QPE) across Colorado. The map is updated daily during the operational season (May 1 – Sep 30) by 11AM. The following six layers are currently available: 24-hour, 48-hour and 72-hour total precipitation, as well as maximum 1-hour, 2-hour and 6-hour precipitation over the past 24 hour period (to estimate where flash flooding may have occurred). The accumulation ending time is 7AM of the date shown in the bottom right corner. Also shown optionally are vulnerable fire burn areas (post 2012), which are updated throughout the season to include new, vulnerable burn areas. The home button in the top left corner resets the map to the original zoom.
SPM 08-12-2021: Showers Along Southern Border

Issue Date: Thursday, August 12th, 2021
Issue Time: 9:30 AM MDT

Summary:

As discussed in the FTB yesterday, Colorado was nestled between two systems: a trough well to the north kept the northern half of the state dry, while monsoonal moisture was able to break into the state along the southern border, allowing for afternoon showers and thunderstorms. Overall rainfall totals remained modest, but a couple places picked up some decent accumulations according to CoCoRaHS observers, including 0.31 inches in Mancos and 0.27 in Chromo (just above the New Mexico border). Storms were more organized along the Raton Ridge and in the Southeast Plains near the Kansas and Oklahoma borders, though winds were a larger concern than heavy rain. The extra bit of moisture and instability allowed for some relief from the smoke in Southern Colorado.

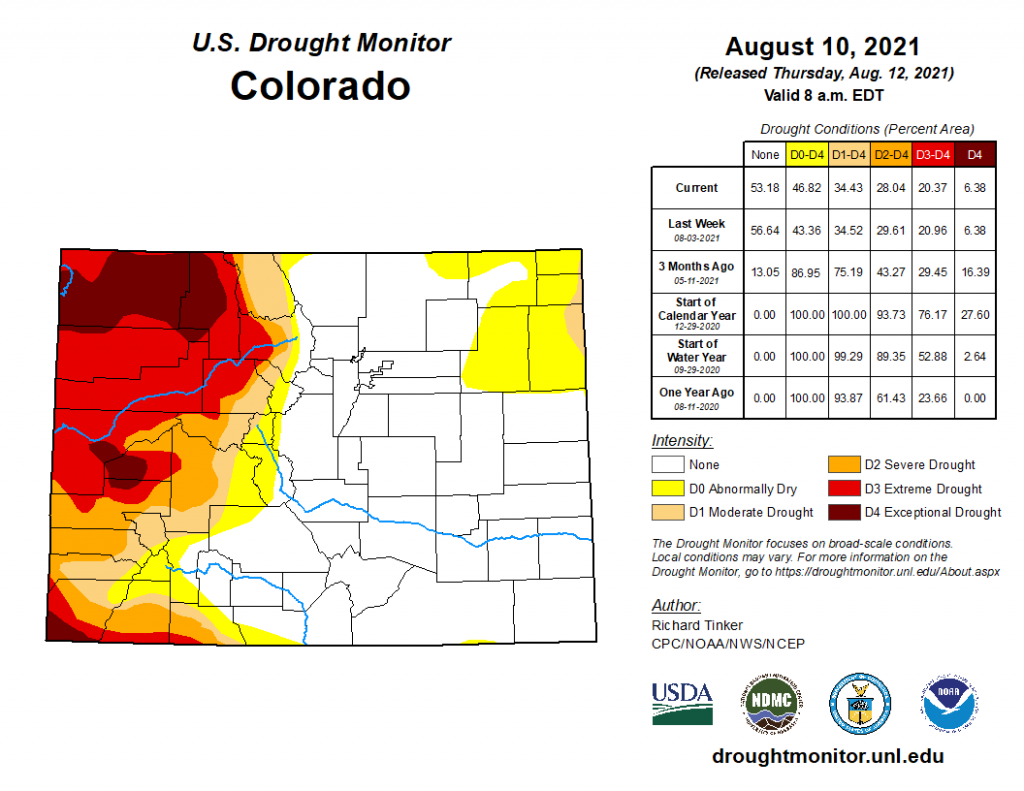
Drought monitor updates released today indicate that the hot and dry pattern is impacting the Northeast Plains. The area of D0 “Abnormally Dry” in the Northeast has expanded to several counties, and a small portion of Phillips and Yuma counties on the Kansas border have reached D1 “Moderate Drought” status. There was little change west of the divide, where conditions remain in D2 “Severe Drought” or worse.

Flooding was not reported on Wednesday. For rainfall estimates in your area, check out the State Precipitation Map below.

Click Here For Map Overview

The map below shows radar-estimated, rainfall gage-adjusted Quantitative Precipitation Estimates (QPE) across Colorado. The map is updated daily during the operational season (May 1 – Sep 30) by 11AM. The following six layers are currently available: 24-hour, 48-hour and 72-hour total precipitation, as well as maximum 1-hour, 2-hour and 6-hour precipitation over the past 24 hour period (to estimate where flash flooding may have occurred). The accumulation ending time is 7AM of the date shown in the bottom right corner. Also shown optionally are vulnerable fire burn areas (post 2012), which are updated throughout the season to include new, vulnerable burn areas. The home button in the top left corner resets the map to the original zoom.