SPM 08-31-2021: Heat and Smoke Return

Issue Date: Tuesday, August 31st, 2021
Issue Time: 9:25 AM MDT

Summary:

The brief cooldown over the weekend abruptly ended on Monday, with hot temperatures and the return of smoke from large fires burning throughout the Western US. Highs were in the 90s across the state, aside from the high elevations which still had temperatures in the high 70s and 80s. Meteorologist Lauren Whitney shared the following picture on twitter, looking east toward Denver from the top of Lookout Mountain – the Downtown Denver skyline is barely visible under the haze and smoke.

In terms of precipitation, daytime heating allowed for very isolated afternoon storms to fire in the high elevations of the San Juan Mountains and Southwest Slope. However limited available moisture kept things dry with mainly gusty outflows. On the Northeast Plains, a line of fast-moving storms developed in the early afternoon. The storms strengthened as they moved eastward towards Kansas, but remained below severe thresholds until the other side of the eastern border. No flooding was reported on Monday. For rainfall estimates in your area, check out the State Precipitation Map below.

Click Here For Map Overview

The map below shows radar-estimated, rainfall gage-adjusted Quantitative Precipitation Estimates (QPE) across Colorado. The map is updated daily during the operational season (May 1 – Sep 30) by 11AM. The following six layers are currently available: 24-hour, 48-hour and 72-hour total precipitation, as well as maximum 1-hour, 2-hour and 6-hour precipitation over the past 24 hour period (to estimate where flash flooding may have occurred). The accumulation ending time is 7AM of the date shown in the bottom right corner. Also shown optionally are vulnerable fire burn areas (post 2012), which are updated throughout the season to include new, vulnerable burn areas. The home button in the top left corner resets the map to the original zoom.

SPM 08-30-2021: Cooler End to the Weekend, Isolated Showers in Southern-Central Colorado

Issue Date: Monday, August 30th, 2021
Issue Time: 10:00 AM MDT

Summary:

Sunday was much cooler to wrap up the weekend, for the eastern half of Colorado at least. High temperatures were 10 degrees or more cooler than Saturday, with highs in the 70s and low 80s for much of Eastern Colorado. However, the Western Slopes and Grand Valley remained hot with highs in the high 80s and low 90s.

In terms of precipitation, Colorado was largely dry aside from isolated thunderstorms aided by a plume of monsoonal moisture that inched up from the south to the Southeast Mountains, San Juan Mountains, and southern portions of the Central and Front Range Mountains. Storms and showers were isolated, but those areas lucky enough to be under a cell received moderate rain and at times hail and high winds.

Two instances of large hail were reported following thunderstorms in Park County. Between 0.5-1.25 inch hail stones were reported at Red Hill Pass and in Jefferson. Precipitation totals around Jefferson were only about 0.12 inches of rain, but a few other nearby locations received more including: 0.23 inches reported above Cheesman Lake, and 0.43 inches in Lost Park. Further southwest, 0.54 inches of rain was reported at Saguache Municipal Airport from a quick afternoon thunderstorm. A nearby CoCoRaHS observer also reported 0.26 inches after “rain fell fairly hard for about 45 to 50 minutes…beginning about 3:45 pm.”

In Manitou Springs, between 0.12-0.50 inches fell across town in just over an hour yesterday afternoon. The same cell that produced some moderate rain at lower elevations also produced hail and graupel at higher elevations on Pikes Peak. Graupel, sometimes called “soft hail”, is the result of ice deposition on a snow crystal. The Pueblo WFO shared the following tweet with pictures of the summit of Pikes Peak blanketed in hail/graupel.

Also on Sunday, a fire of unknown cause started in Grand County, Northeast of Kremmling. It has been named the Black Mountain Fire and has burned approximately 150 acres since yesterday afternoon. More information about the fire can be found here, however it is limited due to how recently the fire started.

No flooding was reported on Sunday. For rainfall estimates in your area, check out the State Precipitation Map below.

Click Here For Map Overview
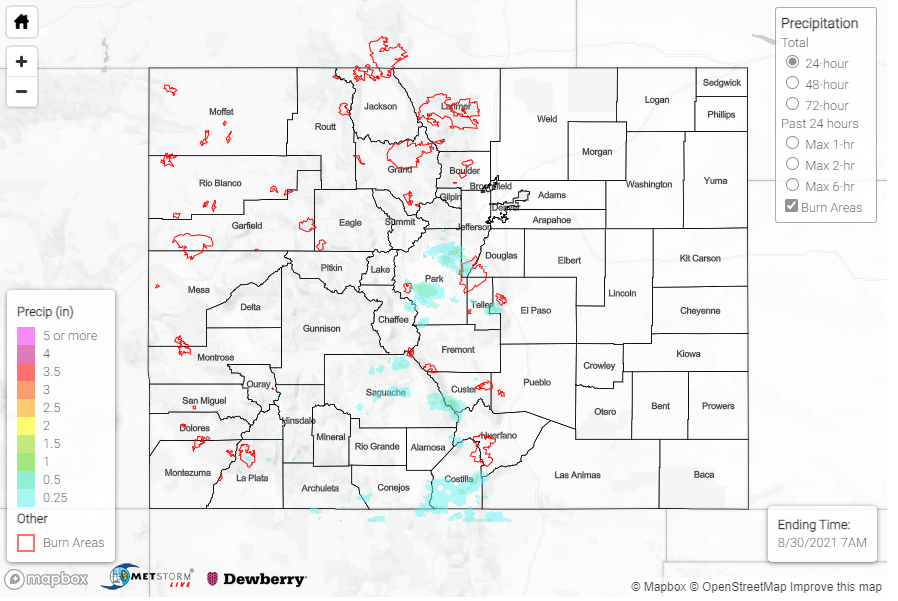
The map below shows radar-estimated, rainfall gage-adjusted Quantitative Precipitation Estimates (QPE) across Colorado. The map is updated daily during the operational season (May 1 – Sep 30) by 11AM. The following six layers are currently available: 24-hour, 48-hour and 72-hour total precipitation, as well as maximum 1-hour, 2-hour and 6-hour precipitation over the past 24 hour period (to estimate where flash flooding may have occurred). The accumulation ending time is 7AM of the date shown in the bottom right corner. Also shown optionally are vulnerable fire burn areas (post 2012), which are updated throughout the season to include new, vulnerable burn areas. The home button in the top left corner resets the map to the original zoom.

Note: The 24-hour, 48-hour and 72-hour total precipitation do not contain bias corrections today due to errors in the CoCoRaHS data. This means there may be underestimations in QPE over the southwest and southeast corners of the state.

SPM 08-29-2021: Record Setting Heat in Southern Colorado Before Cold-Front

Issue Date: Sunday, August 29th, 2021
Issue Time: 10:00 AM MDT

Summary:

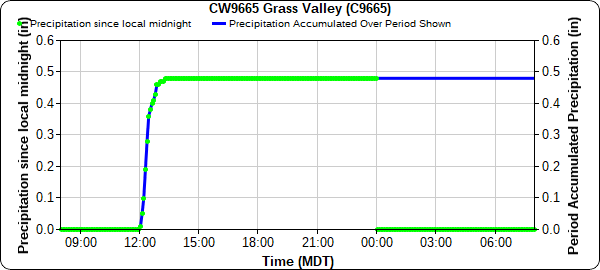
Saturday morning kicked off with a weak cold-front entering the northeast corner of the state, producing a bit of convection ahead of it but very little in terms of precipitation along the Colorado-Nebraska border. Then in the early afternoon scattered showers and thunderstorms began to form in the San Juan Mountains, San Luis Valley, and Southeast Mountains. As the afternoon progressed, southern showers became more widespread, and some convection also built up with the daytime heating along the Front Range Mountains before spilling into the Urban Corridor. If any significant precipitation fell, it was in Southern Colorado: 0.40 was reported in Pagosa Springs by a CoCoRaHS observer, and a quick 0.48 inches was recorded at a APRSWXNET station near Zamara just after noon yesterday (Las Animas County, Grass Valley Station below). A second cold-frontal passage in the evening hours and overnight cooled off the Eastern half of the state, again with little precipitation. Western Colorado remained hot and dry.

The bigger weather story of the day was the impressive heat across Southern Colorado. Records were broken in Alamosa and Colorado Springs, and record-tying heat was reported in Pueblo – the Pueblo WFO shared the following tweets after each record was broken or tied.

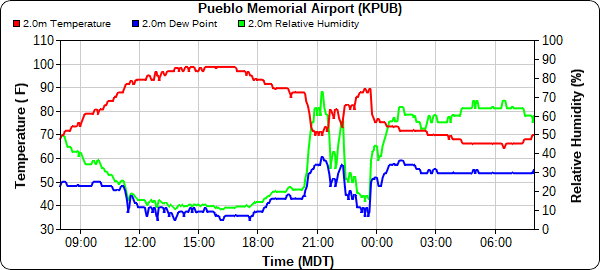
For the second time this summer, the Pueblo WFO also experienced a heat burst before the evening cold-frontal passage. The heat burst was caused by a thunderstorm northeast of Pueblo dissipating and forcing hot, dry air to the surface in the downdraft. This can be seen in the temperature time series from KPUB below, with temperatures rapidly increasing after 9:00 pm up to nearly 90 degrees before 11:00 pm. Temperatures then rapidly decrease again as the cold front passed through the area after 11:00. The Pueblo Airport reported up to 0.29 inches of rain with the initial heat-burst causing thunderstorm. More information about heat bursts can be found here.

No flooding was reported on Saturday. For rainfall estimates in your area, check out the State Precipitation Map below.

Click Here For Map Overview
The map below shows radar-estimated, rainfall gage-adjusted Quantitative Precipitation Estimates (QPE) across Colorado. The map is updated daily during the operational season (May 1 – Sep 30) by 11AM. The following six layers are currently available: 24-hour, 48-hour and 72-hour total precipitation, as well as maximum 1-hour, 2-hour and 6-hour precipitation over the past 24 hour period (to estimate where flash flooding may have occurred). The accumulation ending time is 7AM of the date shown in the bottom right corner. Also shown optionally are vulnerable fire burn areas (post 2012), which are updated throughout the season to include new, vulnerable burn areas. The home button in the top left corner resets the map to the original zoom.

SPM 08-28-2021: Showers in Southeast Colorado

Issue Date: Saturday, August 28th, 2021
Issue Time: 9:30 AM MDT

Summary:

The end of the work week began with a clear morning across much of the state, with west-northwesterly flow ushering in dry air. By afternoon, scattered thunderstorms began to fire up along the high elevations in Southern Colorado, thanks to additional moisture creeping up from the south. Cells were mostly confined to the Southwest Slope, San Juan Mountains, Southeast Mountains, and Raton Ridge. A small cell over Durango produced between 0.27-0.33 inches in just over a 3-hour period.

In the evening, isolated cells also formed along the Urban Corridor before moving eastward onto the Palmer Ridge and Northeast Plains. There was little moisture available for rain with these storms, but impressive lightning was seen across the Urban Corridor into the night – like this video shared on twitter from lightning in Denver.

On the Southeast Plains, widespread showers formed in the in the evening along the exiting trough axis. CoCoRaHs observers in Southeast Colorado reported up to 0.48 inches in Kim (Eastern Las Animas County) and 0.34 in Pritchett (Western Baca County).

There was no flooding reported on Friday. For rainfall estimates in your area, check out the State Precipitation Map below.

Click Here For Map Overview
The map below shows radar-estimated, rainfall gage-adjusted Quantitative Precipitation Estimates (QPE) across Colorado. The map is updated daily during the operational season (May 1 – Sep 30) by 11AM. The following six layers are currently available: 24-hour, 48-hour and 72-hour total precipitation, as well as maximum 1-hour, 2-hour and 6-hour precipitation over the past 24 hour period (to estimate where flash flooding may have occurred). The accumulation ending time is 7AM of the date shown in the bottom right corner. Also shown optionally are vulnerable fire burn areas (post 2012), which are updated throughout the season to include new, vulnerable burn areas. The home button in the top left corner resets the map to the original zoom.