SPM 09-28-2021: Continued Showers for Southwest Colorado, Ptarmigan Fire Ignited in Summit County

Issue Date: Tuesday, September 28th, 2021
Issue Time: 10:30 AM MDT

Summary:

The cutoff low traversing Arizona and New Mexico continued to bring late season monsoonal moisture to Southwest Colorado yesterday. There were already showers along the Colorado-New Mexico border in the in the early morning hours. The general eastward progression of the low and daytime heating then allowed for scattered, but more widespread, storm development over the Southwest Slope, San Juan Mountains, Southeast Mountains, even inching up toward the Central Mountains and southern portion of the Front Range Mountains. Showers and thunderstorms lasted well into the evening hours and overnight, however rainfall rates and total accumulation remained low enough to prevent flooding.

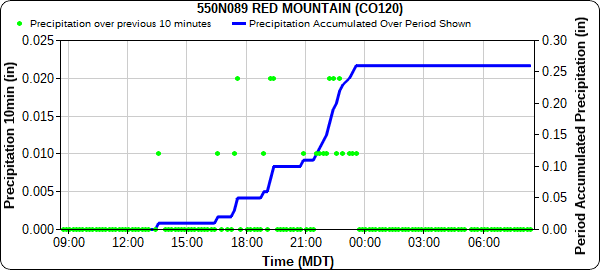
The following hyetograph from Red Mountain, a gauge managed by CDOT, shows the day’s steady rainfall beginning in the afternoon and continuing until just before midnight, with total of 0.26 inches of rain.
Other notable totals from CoCoRaHS observers and gauges in Southwest Colorado include:

  • 0.52 north of Durango
  • 0.52 from a USGS gauge at Mancos River near Towaoc, just north of New Mexico border
  • 0.14-0.50 in the Mancos, Dolores, Cortez region of Montezuma County
  • 0.18-0.46 across Saguache county
  • 0.35 in Pagosa Springs
  • Even Trace-0.11 in southwest Colorado Springs and 0.05-0.10 in the San Luis Valley.

For the rest of the state, the day remained dry and unseasonably warm. Highs were in the 80s and 90s across the Grand Valley, Northwest Slope, Urban Corridor, Palmer Ridge, Raton Ridge, and Eastern Plains. The Ptarmigan Fire was ignited yesterday afternoon in Summit County. The White River National Forest twitter account shared the following image of the fire above Silverthorne yesterday. Since the time of the tweet, the fire has expanded to burn around 40 acres.

No flooding was reported on Monday. For rainfall estimates in your area, check out the State Precipitation Map below.

Click Here For Map Overview

The map below shows radar-estimated, rainfall gage-adjusted Quantitative Precipitation Estimates (QPE) across Colorado. The map is updated daily during the operational season (May 1 – Sep 30) by 11AM. The following six layers are currently available: 24-hour, 48-hour and 72-hour total precipitation, as well as maximum 1-hour, 2-hour and 6-hour precipitation over the past 24 hour period (to estimate where flash flooding may have occurred). The accumulation ending time is 7AM of the date shown in the bottom right corner. Also shown optionally are vulnerable fire burn areas (post 2012), which are updated throughout the season to include new, vulnerable burn areas. The home button in the top left corner resets the map to the original zoom.

SPM 09-27-2021: Late Season Monsoonal Moisture in Southwest

Issue Date: Monday, September 27th, 2021
Issue Time: 10:30 AM MDT

Summary:

Finally, some rainfall to report! As mentioned in the FTB yesterday, a late-season plume of monsoonal moisture has been circulating around a cutoff low located over Arizona, and that moisture finally creeped up into Colorado yesterday. By early afternoon, isolated showers began to form in the Southwest Slope and San Juan Mountains, and then became more widespread in the evening – expanding to the western slopes of the Southeast Mountains as well.

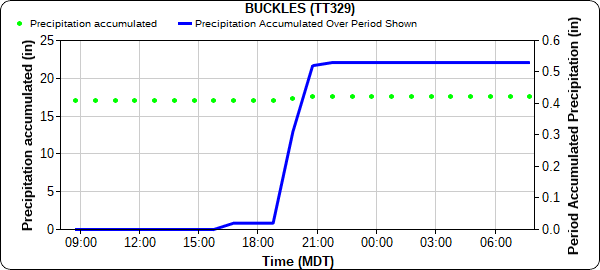
A combination of low rainfall rates and dry soils prevented any flooding or especially large accumulations. CoCoRaHS observers in Durango reported between 0.07-0.17 inches or rain yesterday, and nearby in Ignacio 0.30 inches was reported. Observers in Pagosa Springs reported between 0.20-0.37 inches of rain, and 0.40 inches in Chromo right above the New Mexico border. A RAWS station in Buckles, also near the New Mexico border, picked up 0.53 inches of rain between 4:00 pm and 10:00 pm yesterday, as seen in the hyetograph below.

For the rest of the state, Sunday remained hot and dry. Daily high temperatures in Eastern Colorado reached the 90s, with a high of 99 reported in Granada. Burlington reached 96 degrees, breaking a previous record of 95 set just last year. Along the Urban Corridor, Denver tied their record high minimum temperature (highest daily low temperature) of 60 degrees, previously set in 1948.

For rainfall estimates in your area, check out the State Precipitation Map below.

Click Here For Map Overview
The map below shows radar-estimated, rainfall gage-adjusted Quantitative Precipitation Estimates (QPE) across Colorado. The map is updated daily during the operational season (May 1 – Sep 30) by 11AM. The following six layers are currently available: 24-hour, 48-hour and 72-hour total precipitation, as well as maximum 1-hour, 2-hour and 6-hour precipitation over the past 24 hour period (to estimate where flash flooding may have occurred). The accumulation ending time is 7AM of the date shown in the bottom right corner. Also shown optionally are vulnerable fire burn areas (post 2012), which are updated throughout the season to include new, vulnerable burn areas. The home button in the top left corner resets the map to the original zoom.

SPM 09-26-2021: Getting Warmer Under Building High-Pressure

Issue Date: Sunday, September 26th, 2021
Issue Time: 9:00 AM MDT

Summary:

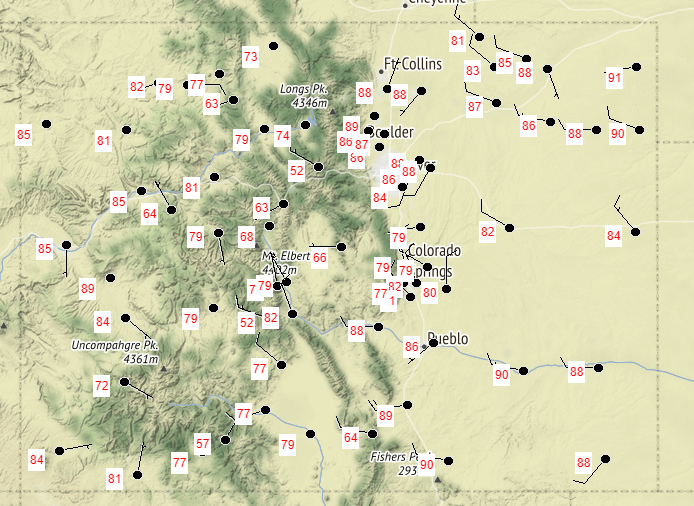
Saturday saw another day with the weather pattern across Colorado dominated by the building high-pressure ridge in the west. This, combined with very dry air, acted to prevent any rainfall and allowed for temperatures to continue to creep up well above seasonal normal. The map below shows yesterday’s high temperatures from all NWS reporting stations across Colorado. Highs were in the 80s (even reaching 90 degrees in a few spots) along the Western Slopes, Grand Valley, Urban Corridor, Raton Ridge, and Eastern Plains. The high elevations of the Northern, Central, San Juan, and Southeast Mountains were in the 70s, along with portions of the Palmer Ridge. As expected, no flooding was reported on Saturday.

Click Here For Map Overview

The map below shows radar-estimated, rainfall gage-adjusted Quantitative Precipitation Estimates (QPE) across Colorado. The map is updated daily during the operational season (May 1 – Sep 30) by 11AM. The following six layers are currently available: 24-hour, 48-hour and 72-hour total precipitation, as well as maximum 1-hour, 2-hour and 6-hour precipitation over the past 24 hour period (to estimate where flash flooding may have occurred). The accumulation ending time is 7AM of the date shown in the bottom right corner. Also shown optionally are vulnerable fire burn areas (post 2012), which are updated throughout the season to include new, vulnerable burn areas. The home button in the top left corner resets the map to the original zoom.

SPM 09-25-2021: Warm, Dry September Day

Issue Date: Saturday, September 25th, 2021
Issue Time: 9:05 AM MDT

Summary:

Building high pressure over the west has kept air dry and stable, preventing any precipitation across Colorado on Friday. Instead, skies remained mostly clear and temperatures hovered at or above seasonal normals. The Northern, Central, Front Range, and San Juan mountains saw highs in the upper 60s and low 70s, while the Western Slopes, Urban Corridor, Palmer Ridge, and Northeast Plains were in the Upper 70s. Highs were in the 80s for the Grand Valley, Raton Ridge, and Southeast Plains. As expected, no flooding was reported on Friday. For rainfall estimates, check out the State Precipitation Map at the bottom of today’s post.

Air quality across the state has also improved since the summer, when smoke and ozone pollution combined to produce terrible haze over much of the state. Currently, a low-pressure system off the coast of Southern California is helping to keep skies clear of smoke for Colorado – pulling the smoke west and offshore rather than east over the continental US. The Boulder NWS shared the following total smoke forecast, showing the large plume of heavy smoke over California and Nevada.

Click Here For Map Overview

The map below shows radar-estimated, rainfall gage-adjusted Quantitative Precipitation Estimates (QPE) across Colorado. The map is updated daily during the operational season (May 1 – Sep 30) by 11AM. The following six layers are currently available: 24-hour, 48-hour and 72-hour total precipitation, as well as maximum 1-hour, 2-hour and 6-hour precipitation over the past 24 hour period (to estimate where flash flooding may have occurred). The accumulation ending time is 7AM of the date shown in the bottom right corner. Also shown optionally are vulnerable fire burn areas (post 2012), which are updated throughout the season to include new, vulnerable burn areas. The home button in the top left corner resets the map to the original zoom.