Issue Date: Monday, September 27th, 2021
Issue Time: 10:30 AM MDT
Summary:
Finally, some rainfall to report! As mentioned in the FTB yesterday, a late-season plume of monsoonal moisture has been circulating around a cutoff low located over Arizona, and that moisture finally creeped up into Colorado yesterday. By early afternoon, isolated showers began to form in the Southwest Slope and San Juan Mountains, and then became more widespread in the evening – expanding to the western slopes of the Southeast Mountains as well.
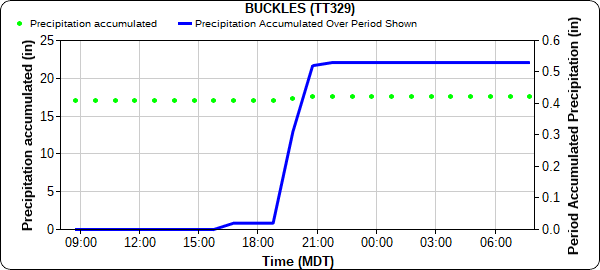
A combination of low rainfall rates and dry soils prevented any flooding or especially large accumulations. CoCoRaHS observers in Durango reported between 0.07-0.17 inches or rain yesterday, and nearby in Ignacio 0.30 inches was reported. Observers in Pagosa Springs reported between 0.20-0.37 inches of rain, and 0.40 inches in Chromo right above the New Mexico border. A RAWS station in Buckles, also near the New Mexico border, picked up 0.53 inches of rain between 4:00 pm and 10:00 pm yesterday, as seen in the hyetograph below.
For the rest of the state, Sunday remained hot and dry. Daily high temperatures in Eastern Colorado reached the 90s, with a high of 99 reported in Granada. Burlington reached 96 degrees, breaking a previous record of 95 set just last year. Along the Urban Corridor, Denver tied their record high minimum temperature (highest daily low temperature) of 60 degrees, previously set in 1948.
For rainfall estimates in your area, check out the State Precipitation Map below.
Click Here For Map Overview

