SPM 09-09-2017: Scattered, High Elevation Storms with Impressive Rainfall Rates

Issue Date: Saturday, September 9, 2017
Issue Time: 10:15AM MDT

Summary:

The strong ridging pattern continued its hold over the state again yesterday. Even with the upper-level trough attempting to pull moisture northward, the low-level moisture was confined to the SW states. The light upper-level winds and inversion created another day with hazy conditions from the fires to the north. Moderate mid-level moisture was able to make its way into western Colorado yesterday. With enough moisture over the eastern portion of the state as well, showers and cloud cover were more numerous over the mountains.

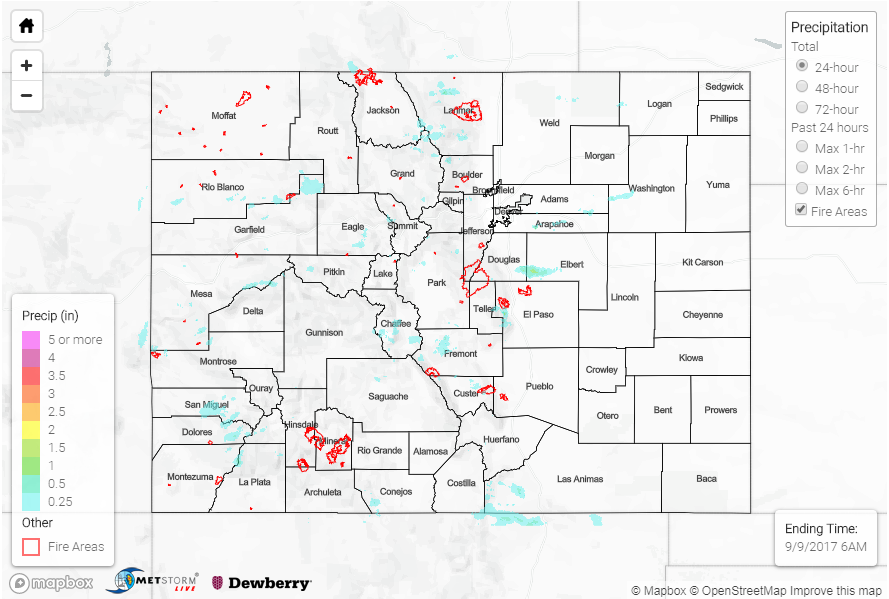
Isolated storms began to initiate over the higher terrains in the early afternoon and slowly drifted E/SE. With Precipitable Water near 0.65 inches in the adjacent plains in eastern Colorado, showers produced impressive brief, heavy rain and gusty winds. In El Paso County, CoCoRaHS and USGS stations recorded around 0.3 inches of rain. Rainfall estimates by radar in this area were 1 inch. Just north over Elbert County, a small and strong thunderstorm produced over 1 inch of rain in 1 hour according to radar estimates and a CoCoRaHS station nearby. Over the San Juan Mountains, storm totals were estimated as high as 0.5 inches with a SNOTEL station recording 0.4 inches.

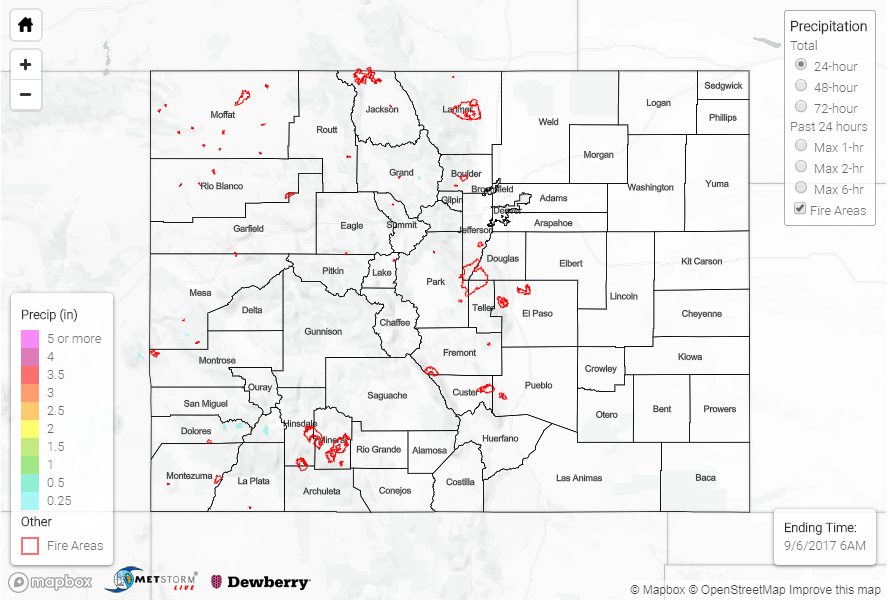
There was no flooding reported Friday. For rainfall estimates in your area, take a peek at the State Precipitation Map below.

Click Here For Map Overview

The map below shows radar-estimated, rainfall gage-adjusted Quantitative Precipitation Estimates (QPE) across Colorado. The map is updated daily during the operational season (May 1 – Sep 30) by 11AM. The following six layers are currently available: 24-hour, 48-hour and 72-hour total precipitation, as well as maximum 1-hour, 2-hour and 6-hour precipitation over the past 24 hour period (to estimate where flash flooding may have occurred). The accumulation ending time is 6AM of the date shown in the bottom right corner. Also shown optionally are fire burn areas since 2012. The home button in the top left corner resets the map to the original zoom.

Note: We have identified a possible underestimation in QPE over the southwest part of the state. We are working to on this issue, and will provide an update as soon as possible.

SPM 09-08-2017: Storm Coverage Increased Across High Country

Issue Date: Friday, September 8, 2017
Issue Time: 10:05AM MDT

Summary:

A shortwave moving southward out of Wyoming helped provide an increase in shower and thunderstorm coverage, mainly across the High Country. However, with only marginal boundary layer moisture, rainfall rates were limited. CoCoRaHS reports of a few tenths of an inch to as much as 0.5 inches were received in Las Animas, Huerfano, Pueblo and Archuleta counties. Radar-based estimates suggest up to 1 inch of rainfall fell in isolated parts of these areas. A precautionary Areal Flood Advisory was issued for the Junkins burn scar yesterday afternoon where a 0.25 to 0.5 inches of rain was estimated by radar. Farther north, storm coverage was isolated to widely scattered with only a trace to 0.1 inches.

Otherwise, hazy skies were once again commonplace across most of the state from the Pacific Northwest fires.

Flooding was not reported on Thursday. For rainfall estimates in your area, check out our State Precipitation Map below.

Click Here For Map Overview

The map below shows radar-estimated, rainfall gage-adjusted Quantitative Precipitation Estimates (QPE) across Colorado. The map is updated daily during the operational season (May 1 – Sep 30) by 11AM. The following six layers are currently available: 24-hour, 48-hour and 72-hour total precipitation, as well as maximum 1-hour, 2-hour and 6-hour precipitation over the past 24 hour period (to estimate where flash flooding may have occurred). The accumulation ending time is 6AM of the date shown in the bottom right corner. Also shown optionally are fire burn areas since 2012. The home button in the top left corner resets the map to the original zoom.

Note: We have identified a possible underestimation in QPE over the southwest part of the state. We are working to on this issue, and will provide an update as soon as possible.

SPM 09-07-2017: Persistent Haze with Isolated Showers in the Southern Mountains

Issue Date: Thursday, September 7, 2017
Issue Time: 10:00AM MDT

Summary:

Haze continued to plague the majority of the state once again on Wednesday with the northwest flow aloft. Most of the smoke was limited to the middle and upper levels of the atmosphere except over the Northwest Slope and northern mountains. Visibility in this region was once again limited to the 6-7 mile range. Temperatures were near normal yesterday for the eastern portion of the state with the Grand Valley reaching the low 90s once again. Overnight lows were about 5F warmer than Tuesday night.

Another quiet day of weather in regards to rainfall. The high pressure and ridging pattern to the west continues to promote subsidence and suppress advection of moisture into the state. Residual moisture further south helped in the formation of some light showers with the diurnal flow. Afternoon showers were predominantly over the San Juan Mountains with SNOTEL stations in the area recording 0.2 inches of rainfall. Radar estimates were up to 0.5 inches. Another isolated shower formed over the Southeast Mountains around 9:30 PM. Radar estimated 0.25 inches of rain over Las Animas County with a CoCoRaHS station in the area recording 0.14 inches.

There was no flooding reported Wednesday. To see if rain fell in your neighborhood, scroll down to the State Precipitation Map below.

Click Here For Map Overview

The map below shows radar-estimated, rainfall gage-adjusted Quantitative Precipitation Estimates (QPE) across Colorado. The map is updated daily during the operational season (May 1 – Sep 30) by 11AM. The following six layers are currently available: 24-hour, 48-hour and 72-hour total precipitation, as well as maximum 1-hour, 2-hour and 6-hour precipitation over the past 24 hour period (to estimate where flash flooding may have occurred). The accumulation ending time is 6AM of the date shown in the bottom right corner. Also shown optionally are fire burn areas since 2012. The home button in the top left corner resets the map to the original zoom.

Note: We have identified a possible underestimation in QPE over the southwest part of the state. We are working to on this issue, and will provide an update as soon as possible.

SPM 09-06-2017: Cooler Temperatures East with Heat Continuing West

Issue Date: Wednesday, September 6, 2017
Issue Time: 10:00AM MDT

Summary:

Much cooler temperatures yesterday for the eastern portion of the state with the passage of a cold front Monday night. High temperatures yesterday were 15-20F cooler than Monday with the eastern plains reaching the mid-70s. Overnight lows were around 40F (east) and 30F (west). Over the western portion of the state, temperatures remained warm. The shallow cold front was not able to move over the Continental Divide, and highs in the Grand Valley were in the mid-90s. There was a reduction in haze at the low-levels yesterday for the eastern portion of the state with the cold front passage. However, smoke continued to be advected into the state with the high pressure to the west. The northwest corner of the state had visibility limited to a 6 mile range during the afternoon with haze also reported in the mountains.

Dry air and cooler, stable east limited convection to light showers over the mountains yesterday. A couple SNOTEL stations recorded 0.2 inches over the higher terrains. Radar rainfall estimates over the San Juan Mountains were only 0.25 inches. There was no flooding reported Tuesday.

Below is a look at the percent of normal precipitation for the month of August across Colorado. The eastern plains, northern Front Range and Central Mountains all received above normal precipitation. Aligned with climatology, the Wet Mountains also received above average precipitation. The majority of the western portion of the state was abnormally dry for August including the climatologically favored region of the San Juan Mountains.

To see if rain fell in your area, scroll down to the State Precipitation Map below.

Click Here For Map Overview

The map below shows radar-estimated, rainfall gage-adjusted Quantitative Precipitation Estimates (QPE) across Colorado. The map is updated daily during the operational season (May 1 – Sep 30) by 11AM. The following six layers are currently available: 24-hour, 48-hour and 72-hour total precipitation, as well as maximum 1-hour, 2-hour and 6-hour precipitation over the past 24 hour period (to estimate where flash flooding may have occurred). The accumulation ending time is 6AM of the date shown in the bottom right corner. Also shown optionally are fire burn areas since 2012. The home button in the top left corner resets the map to the original zoom.

Note: We have identified a possible underestimation in QPE over the southwest part of the state. We are working to on this issue, and will provide an update as soon as possible.