SPM 09-13-2017: Decrease in Shower Coverage over the High Terrains

Issue Date: Wednesday, September 13, 2017
Issue Time: 10:15AM MDT

Summary:

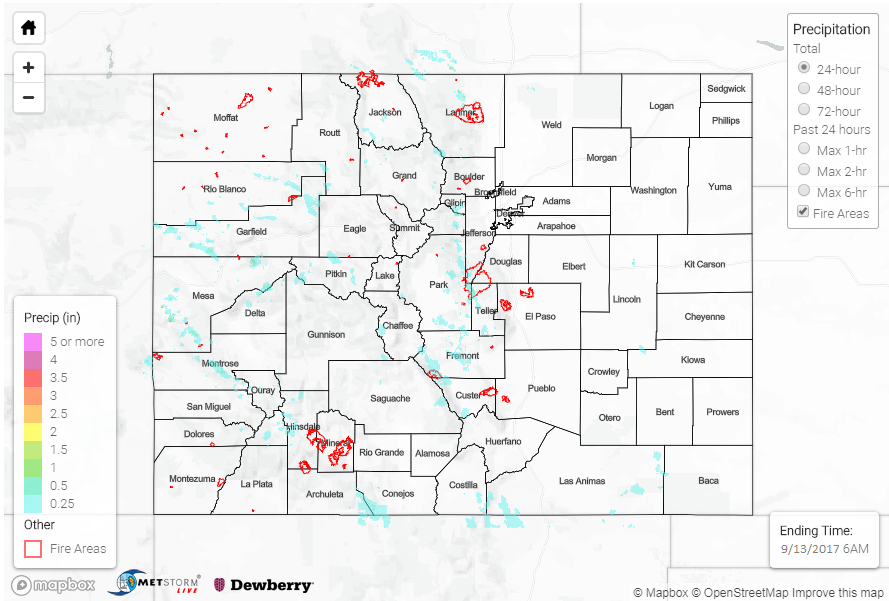
Decreasing moisture and weak mid-level dynamics caused showers to be more scattered in nature over the high country yesterday. Mostly clear skies allowed for instability to build earlier in the day and showers began forming over the higher terrains just after noon. Initially, the most abundant showers were over the San Juan and Northern Mountains where dew points were in the low to 40s. This created high-based thunderstorms, which produced more wind than rainfall. Later in the afternoon and evening the shower activity shifted to the southern Front Range and Southeast Mountains.

Over the western mountains, up north, rain observations were as high as 0.38 inches. Radar estimates were around 0.5 inches. Further south, the totals decreased and most observations were in the 0.15 to 0.25 range although radar rainfall estimates in Conejos County were 0.5 inches. Along the Southeast Mountains, a SNOTEL station north of Fort Garland recorded 0.4 inches in the evening. This same storm prompted an Areal Flood Advisory over the Hayden Pass Burn Scar, but no flooding was reported. Radar estimates over this area were up to 0.5 inches. It should be noted that the Pueblo NWS radar is down for maintenance through the end of September, so radar rainfall estimates in this region will be affected.

There was no flooding reported on Tuesday. For rainfall estimates in your neighborhood, scroll down to the State Precipitation Map below.

Click Here For Map Overview

The map below shows radar-estimated, rainfall gage-adjusted Quantitative Precipitation Estimates (QPE) across Colorado. The map is updated daily during the operational season (May 1 – Sep 30) by 11AM. The following six layers are currently available: 24-hour, 48-hour and 72-hour total precipitation, as well as maximum 1-hour, 2-hour and 6-hour precipitation over the past 24 hour period (to estimate where flash flooding may have occurred). The accumulation ending time is 6AM of the date shown in the bottom right corner. Also shown optionally are fire burn areas since 2012. The home button in the top left corner resets the map to the original zoom.

Note: We have identified a possible underestimation in QPE over the southwest part of the state. We are working to on this issue, and will provide an update as soon as possible.

SPM 09-12-2017: Rainfall Coverage And Intensity Increased

Issue Date: Tuesday, September 12, 2017
Issue Time: 11AM MDT

Summary:

A weak disturbance and above normal moisture content was enough to increase thunderstorm coverage across Colorado on Monday. As is frequently the case, the vast majority of storms were garden variety, producing a few tenths of an inch of range over most of the High Country and adjacent foothills above about 7,000 feet. However, a few storms stood out from the rest. The storm of the day was likely in western Elbert County, where a quick 1 inch of rain fell in less than 30 minutes. Radar-enhanced estimates suggest up to 2 inches of rain fell in 1 hour. Another area of enhanced rainfall activity was in Chaffee County where up to 1.5 inches of rain fell in about 1 hour or less. West of the Continental Divide, rainfall amounts were lower with up to 0.6 inches falling mainly over the higher elevations of the San Juans. Small hail was reported in Routt County, south of Steamboat Springs from a small cell during the late afternoon hours.

Flooding was not reported on Monday. For rainfall estimates in your area, check out our State Precipitation Map below.

Click Here For Map Overview

The map below shows radar-estimated, rainfall gage-adjusted Quantitative Precipitation Estimates (QPE) across Colorado. The map is updated daily during the operational season (May 1 – Sep 30) by 11AM. The following six layers are currently available: 24-hour, 48-hour and 72-hour total precipitation, as well as maximum 1-hour, 2-hour and 6-hour precipitation over the past 24 hour period (to estimate where flash flooding may have occurred). The accumulation ending time is 6AM of the date shown in the bottom right corner. Also shown optionally are fire burn areas since 2012. The home button in the top left corner resets the map to the original zoom.

Note: We have identified a possible underestimation in QPE over the southwest part of the state. We are working to on this issue, and will provide an update as soon as possible.

SPM 09-11-2017: Scattered Showers over Higher Terrains

Issue Date: Monday, September 11, 2017
Issue Time: 10:30AM MDT

Summary:

Increase moisture from southwest and westerly flow continued to fuel the daily rounds of thunderstorms over the higher terrains. More shortwave energy from the west coast trough also made it into the state yesterday increasing coverage over the mountains. This extra energy also helped a few showers linger overnight. Storms began to fire over the mountains around 1PM and favored the northern portion of the state as well as the Southeast Mountains. Storm bases were still quite high, which limited rainfall totals, but more rain reached the surface than the prior days. As the storms moved off the mountains, they favored the Cheyenne and Palmer Ridges.

A couple of SNOTEL stations over the mountains recorded up to 0.7 inches. One of these stations was in the San Juan Mountains where storms were more isolated in nature yesterday. Over the Front Range, in Teller County, a CoCoRaHS station recorded 0.76 inches with radar rainfall estimates up to 1 inch. There were two areal flood advisories for Custer County near the Junkins Burn Scar. Luckily no flooding was reported. Radar rainfall estimates were just over 1 inch in this area. Most storms that moved off the higher terrains into the plains were short-lived with rainfall estimates just over 1 inch.

As of Monday morning, there was no flooding reported. For rainfall estimates over your area, take a look at the State Precipitation Map below.

Click Here For Map Overview

The map below shows radar-estimated, rainfall gage-adjusted Quantitative Precipitation Estimates (QPE) across Colorado. The map is updated daily during the operational season (May 1 – Sep 30) by 11AM. The following six layers are currently available: 24-hour, 48-hour and 72-hour total precipitation, as well as maximum 1-hour, 2-hour and 6-hour precipitation over the past 24 hour period (to estimate where flash flooding may have occurred). The accumulation ending time is 6AM of the date shown in the bottom right corner. Also shown optionally are fire burn areas since 2012. The home button in the top left corner resets the map to the original zoom.

Note: We have identified a possible underestimation in QPE over the southwest part of the state. We are working to on this issue, and will provide an update as soon as possible.

SPM 09-10-2017: Increase in Shower Coverage

Issue Date: Sunday, September 10, 2017
Issue Time: 10:10AM MDT

Summary:

With the ridge over Texas and upper-level trough over the west coast, more southerly flow brought an increase of moisture into the southern portion of the state. The influx of moisture, however, was minimal with dew points reaching the mid to upper 40s. This translated into another day of high-based showers and thunderstorms with gusty winds. The storms that initiated over the high country were more numerous than the previous days with this slight increase in moisture. As storms began to move off the mountains in the afternoon, they favored the higher terrains of the Cheyenne and Palmer Ridges.

Meteorological stations over the mountains recorded storm totals greater than the last couple of days with the slight uptick in moisture. A couple SNOTEL stations recorded 0.4 inches with other stations recording around 0.5 inches. The highest storm report was in Fremont County where 0.6 inches was recorded along with small hail. Over La Plata County, 0.41 inches was recorded by a CoCoRaHS station. Radar rainfall estimates were on par with these observations. A few isolated storms were able to briefly survive over the eastern plains where radar estimates were just over 1 inch. All storms ended a couple hours after sundown with the decrease in instability. There was no flooding reported Saturday.

For rainfall estimates over the state yesterday, take a look at the State Precipitation Map below.

Click Here For Map Overview

The map below shows radar-estimated, rainfall gage-adjusted Quantitative Precipitation Estimates (QPE) across Colorado. The map is updated daily during the operational season (May 1 – Sep 30) by 11AM. The following six layers are currently available: 24-hour, 48-hour and 72-hour total precipitation, as well as maximum 1-hour, 2-hour and 6-hour precipitation over the past 24 hour period (to estimate where flash flooding may have occurred). The accumulation ending time is 6AM of the date shown in the bottom right corner. Also shown optionally are fire burn areas since 2012. The home button in the top left corner resets the map to the original zoom.

Note: We have identified a possible underestimation in QPE over the southwest part of the state. We are working to on this issue, and will provide an update as soon as possible.