Issue Date: Thursday, May 3rd, 2018
Issue Time: 9:40 AM MDT
Summary:
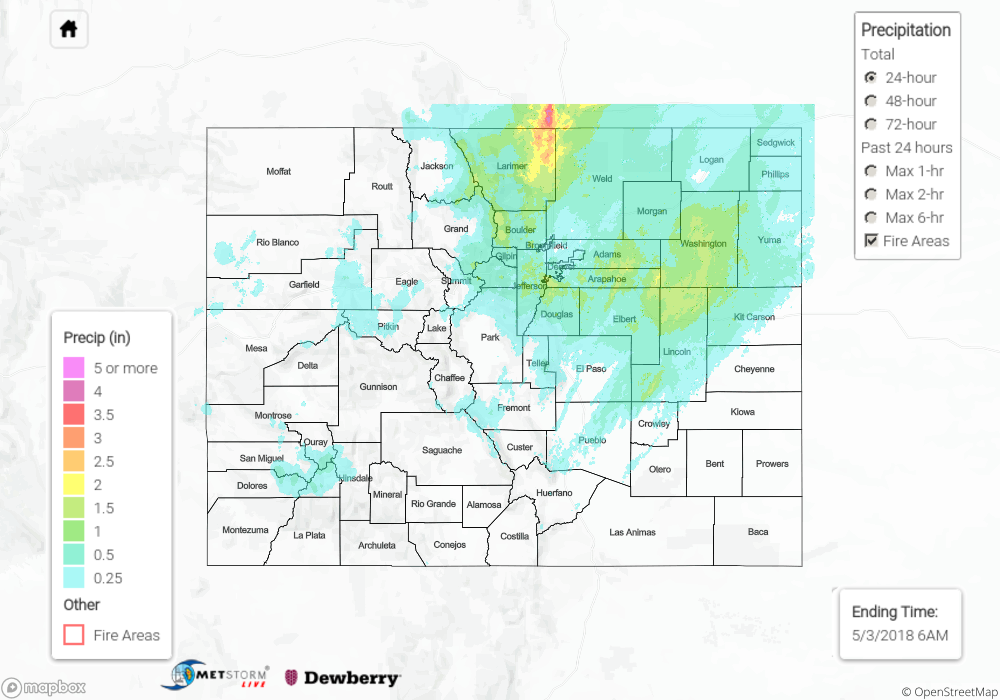
Scattered-to-widespread showers and thunderstorms impacted the state yesterday, and continue to do so this morning, thanks to the presence of an upper-level disturbance and plenty of moisture being pulled in from the Pacific. Most everywhere in the state got in on the action except for the far Southeast Plains, which hung on to the drier conditions and mustered only an isolated light shower or two. The high country received periods of heavy snow, generally above 9,000 feet, with 6-10 inches (or more) reported in some locations. As temperatures cooled overnight, snow levels dropped to as low as 7,000 feet this morning, bringing some accumulating snow to locations in the foothills and higher elevations of the Palmer Ridge.
For elevations below 9,000 feet (sans this morning’s transition to snow between 7,000-9,000 feet), rainfall was generally light-to-moderate, with pockets of heavier rain mixed in across the Northeast Plains, Palmer Ridge, and Urban Corridor regions. Small hail accompanied a few thunderstorms, with the largest hail of the day (0.88 inches in diameter) reported 6 miles W of Punkin Center (Lincoln County).
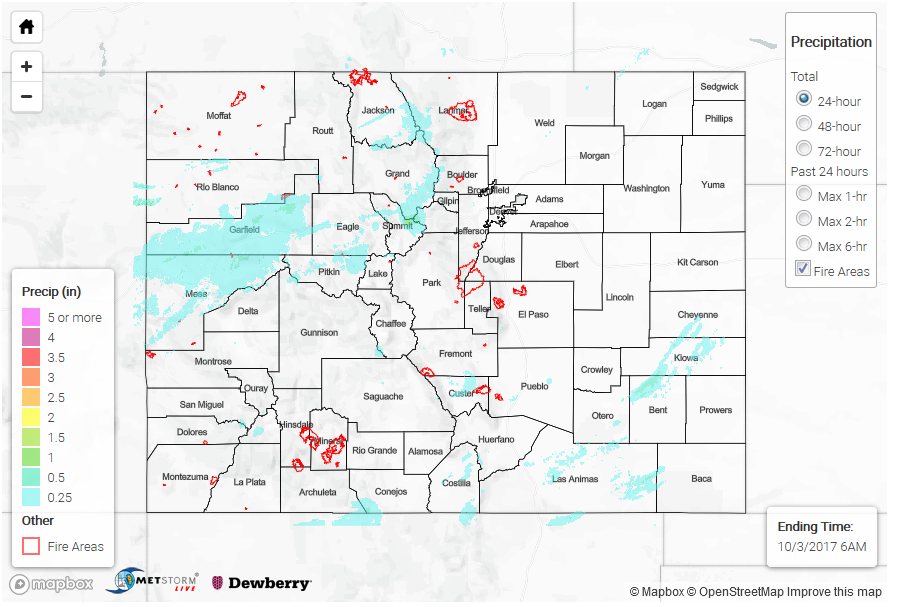
Flash flooding was not reported yesterday. For a look at precipitation estimates in your area, please see our State Precipitation Map below.
Click Here For Map Overview
Note: We have identified a possible underestimation in QPE over the southwest part of the state. We are working to on this issue, and will provide an update as soon as possible.