SPM 06-12-2018: Cooler High Temperatures Bring Relief from Weekend Heat

Issue Date: Tuesday, June 12, 2018
Issue Time: 10:20AM MDT

Summary:

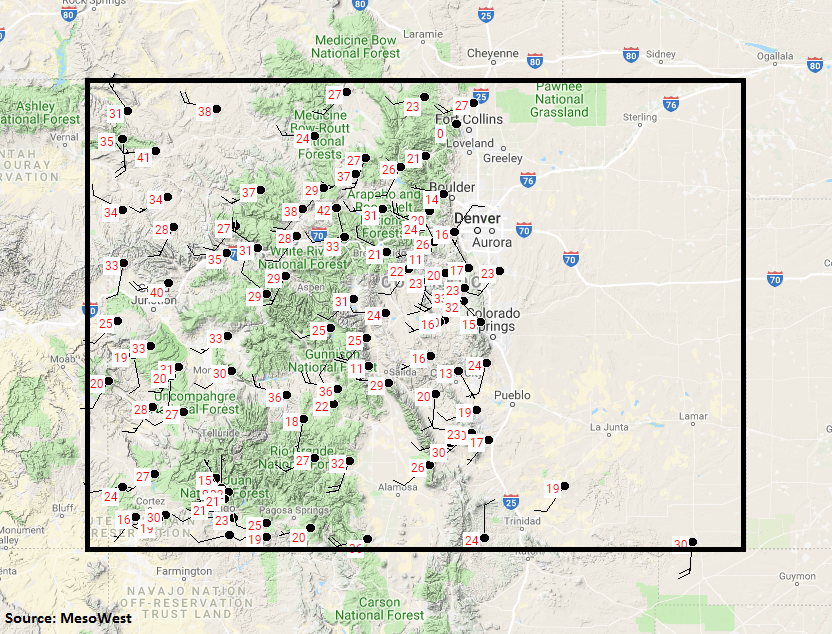
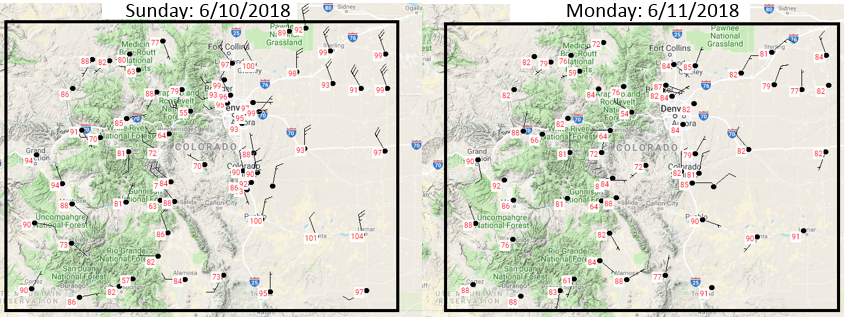
A cold front that moved through the state on Sunday night helped bring some relief from the heat on Monday. High temperatures were quite a bit lower over the eastern plains (10-15F) with most other locations seeing a decrease in high temperatures closer to 5F. Unfortunately, the dry streak continues with no precipitation anywhere in the state on Monday.

The 416 fire continues to burn in the San Juan National Forest and has now scorched 23,378 acres as of this morning. Containment remains at 15 percent and thankfully winds died down over the area yesterday. The forecast still looks on track for some subtropical moisture arriving this Thursday to the San Juan Mountains. Hopefully these will be more wetting rains rather than storms that produce gusty winds and lightning that could potentially start another fire. The bigger northward push of the subtropical moisture is forecast for this weekend. There will be a much better chance of these rains producing meaningful moisture and providing some relief to the area. This is still quite far out, so the details can change quite a bit. Tune back to the FTO on Thursday for the evolving details of this potentially beneficial rainfall event.

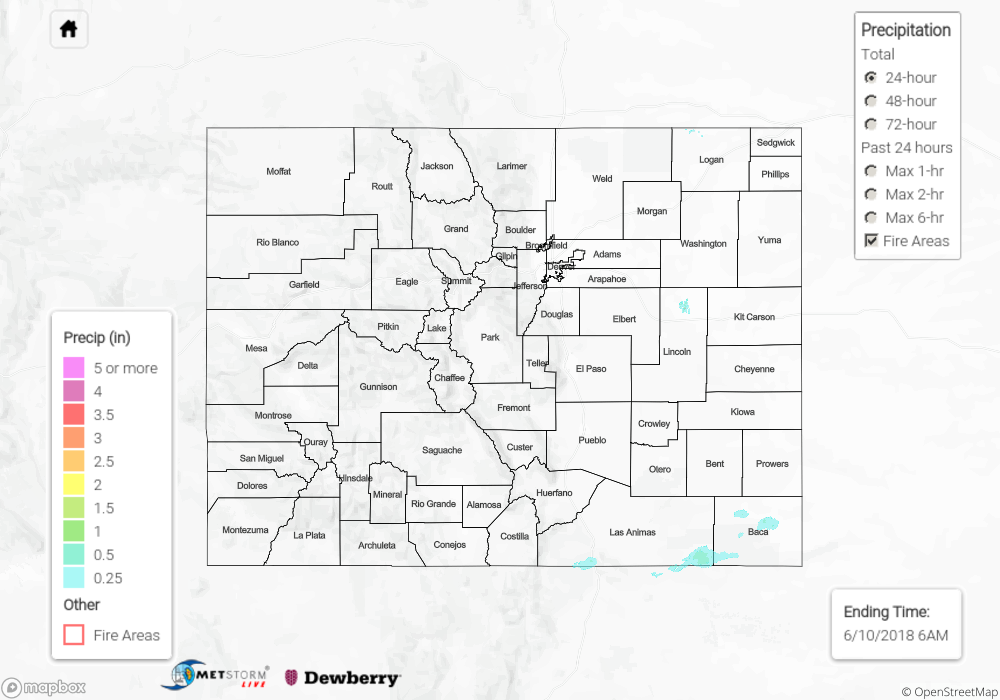
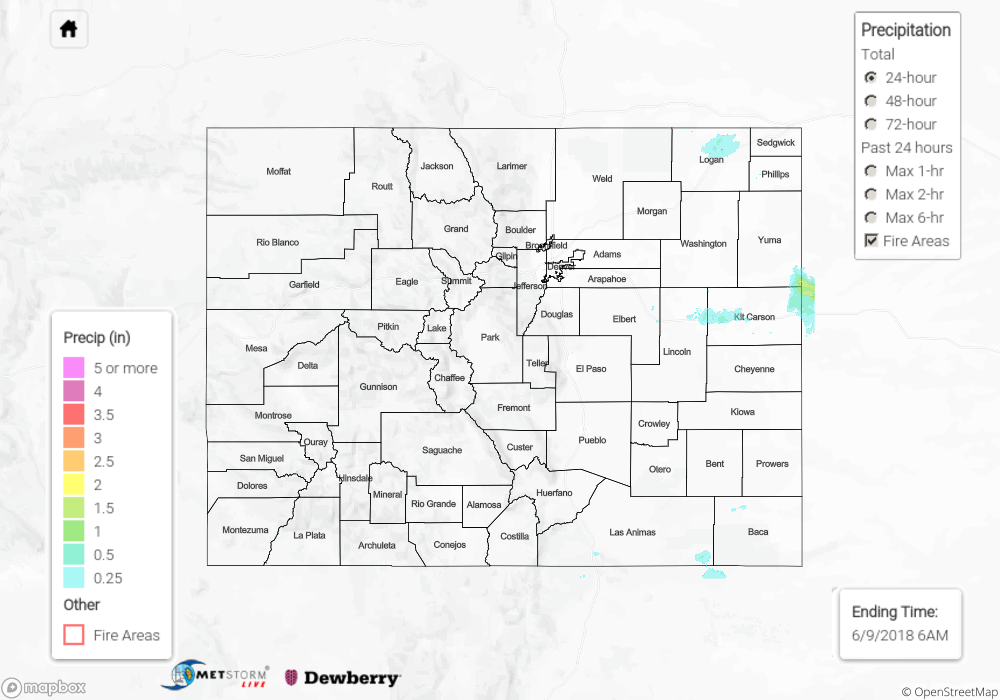
If you’re interested in the rain that has fallen over the last 72-hours, scroll down to the State Precipitation Map below.

Click Here For Map Overview

The map below shows radar-estimated, rainfall gage-adjusted Quantitative Precipitation Estimates (QPE) across Colorado. The map is updated daily during the operational season (May 1 – Sep 30) by 11AM. The following six layers are currently available: 24-hour, 48-hour and 72-hour total precipitation, as well as maximum 1-hour, 2-hour and 6-hour precipitation over the past 24 hour period (to estimate where flash flooding may have occurred). The accumulation ending time is 6AM of the date shown in the bottom right corner. Also shown optionally are fire burn areas since 2012. The home button in the top left corner resets the map to the original zoom.

Note: We have identified a possible underestimation in QPE over the southwest part of the state. We are working to on this issue, and will provide an update as soon as possible.

SPM 06-11-2018: Hot, Dry Streak Continues with Gusty Winds Fueling Fires

Issue Date: Monday, June 11, 2018
Issue Time: 09:30AM MDT

Summary:

Another hot, dry day for Colorado on Sunday. Temperatures over the eastern plains reached or were close to 100F with the highest temperature reading at Lamar (104F). Western Colorado NWS and RAWS sites recorded temperatures in the 80F to 90F range with Grand Junction reaching 94F. Yesterday, the Pacific trough moved into the Great Basin, which increased wind speeds and fanned the fires across the state. The 416 fire was able to double in size this weekend due to critical fire conditions. Most gusts over western Colorado were in the 30-40 mph range. The image below shows the RAWS max wind gusts from yesterday. Unfortunately, there was no measurable precipitation on Sunday even with the passage of a cold front last night. There were a few rain drops over the Baca County, but not enough to register on today’s State Precipitation Map. For rainfall estimates over your area, scroll down to the State Precipitation Map below.


Click Here For Map Overview

The map below shows radar-estimated, rainfall gage-adjusted Quantitative Precipitation Estimates (QPE) across Colorado. The map is updated daily during the operational season (May 1 – Sep 30) by 11AM. The following six layers are currently available: 24-hour, 48-hour and 72-hour total precipitation, as well as maximum 1-hour, 2-hour and 6-hour precipitation over the past 24 hour period (to estimate where flash flooding may have occurred). The accumulation ending time is 6AM of the date shown in the bottom right corner. Also shown optionally are fire burn areas since 2012. The home button in the top left corner resets the map to the original zoom.

Note: We have identified a possible underestimation in QPE over the southwest part of the state. We are working to on this issue, and will provide an update as soon as possible.

SPM 06-10-2018: Exceptionally Hot and Dry to Start the Weekend

Issue Date: Sunday, June 10, 2018
Issue Time: 10:40AM MDT

Summary:

It was more of the same hot and dry weather for Saturday across Colorado, as the upper atmosphere ridge continued to stay put over the Southwest. Daytime highs near 100 degrees were felt across the eastern plains, and even the high country couldn’t escape the unusually hot weather. Some storms were able to develop over the Central Mountains, but with a lack of moisture to build off of they mostly created wisps of virga and the occasional light rain shower. The highest credible rainfall report, a CoCoRaHS gauge in Eagle County near Avon, recorded 0.1 inches for the day. There may have been higher rainfall totals elsewhere across the more sparsely-populated areas of the high country, but not enough for any sort of flooding to occur.


Click Here For Map Overview

The map below shows radar-estimated, rainfall gage-adjusted Quantitative Precipitation Estimates (QPE) across Colorado. The map is updated daily during the operational season (May 1 – Sep 30) by 11AM. The following six layers are currently available: 24-hour, 48-hour and 72-hour total precipitation, as well as maximum 1-hour, 2-hour and 6-hour precipitation over the past 24 hour period (to estimate where flash flooding may have occurred). The accumulation ending time is 6AM of the date shown in the bottom right corner. Also shown optionally are fire burn areas since 2012. The home button in the top left corner resets the map to the original zoom.

Note: We have identified a possible underestimation in QPE over the southwest part of the state. We are working to on this issue, and will provide an update as soon as possible.

SPM 06-09-2018: More Heat, just a little Rain, and Snowpack Nearing its End

Issue Date: Saturday, June 9, 2018
Issue Time: 09:45AM MDT

Summary:

Yesterday was largely quiet on the rainfall front across Colorado, with just a handful of isolated storms managing to overcome the dry surface air that was in place across the vast majority of the state. The top credible rainfall report from yesterday was just 0.23”, from a CoCoRaHS observer 8.1 miles NE of Burlington (Kit Carson County). Radar indicates rainfall of 0.5-0.75” may have occurred in a handful of locations, such as near the communities of Arriba and Flagler along I-70 in the eastern plains, but these estimates were not borne out by gauge data (Flagler reported just 0.15”). Overall, it was a largely dry day, with temperatures again near or at record highs across a large portion of the state.

With the recent heat and dryness, snowpack has been rapidly on the decline across the state. In fact, as the statewide snow water equivalent (SWE) graphic below indicates, we have effectively reached full summer conditions, with near-zero SWE across the state’s mountain ranges as of yesterday (June 8; this year shown in bold dark blue line). This is about two weeks ahead of the median melt-out date and nearly a month ahead of the average (mean) melt-out. While this is a boon for hikers and others who like to enjoy the high country during summer, the exposure of bare, dry ground earlier can mean higher fire risk later in the summer. Fortunately, however, state reservoirs continue to be in good shape storage-wise, and we therefore expect little in the way of issues with state water resources.

Flooding was not reported on Friday. For rainfall estimates over your area, scroll down to the State Precipitation Map below.

Click Here For Map Overview

The map below shows radar-estimated, rainfall gage-adjusted Quantitative Precipitation Estimates (QPE) across Colorado. The map is updated daily during the operational season (May 1 – Sep 30) by 11AM. The following six layers are currently available: 24-hour, 48-hour and 72-hour total precipitation, as well as maximum 1-hour, 2-hour and 6-hour precipitation over the past 24 hour period (to estimate where flash flooding may have occurred). The accumulation ending time is 6AM of the date shown in the bottom right corner. Also shown optionally are fire burn areas since 2012. The home button in the top left corner resets the map to the original zoom.

Note: We have identified a possible underestimation in QPE over the southwest part of the state. We are working to on this issue, and will provide an update as soon as possible.