Issue Date: Saturday, June 9, 2018
Issue Time: 09:45AM MDT
Summary:
Yesterday was largely quiet on the rainfall front across Colorado, with just a handful of isolated storms managing to overcome the dry surface air that was in place across the vast majority of the state. The top credible rainfall report from yesterday was just 0.23”, from a CoCoRaHS observer 8.1 miles NE of Burlington (Kit Carson County). Radar indicates rainfall of 0.5-0.75” may have occurred in a handful of locations, such as near the communities of Arriba and Flagler along I-70 in the eastern plains, but these estimates were not borne out by gauge data (Flagler reported just 0.15”). Overall, it was a largely dry day, with temperatures again near or at record highs across a large portion of the state.
With the recent heat and dryness, snowpack has been rapidly on the decline across the state. In fact, as the statewide snow water equivalent (SWE) graphic below indicates, we have effectively reached full summer conditions, with near-zero SWE across the state’s mountain ranges as of yesterday (June 8; this year shown in bold dark blue line). This is about two weeks ahead of the median melt-out date and nearly a month ahead of the average (mean) melt-out. While this is a boon for hikers and others who like to enjoy the high country during summer, the exposure of bare, dry ground earlier can mean higher fire risk later in the summer. Fortunately, however, state reservoirs continue to be in good shape storage-wise, and we therefore expect little in the way of issues with state water resources.

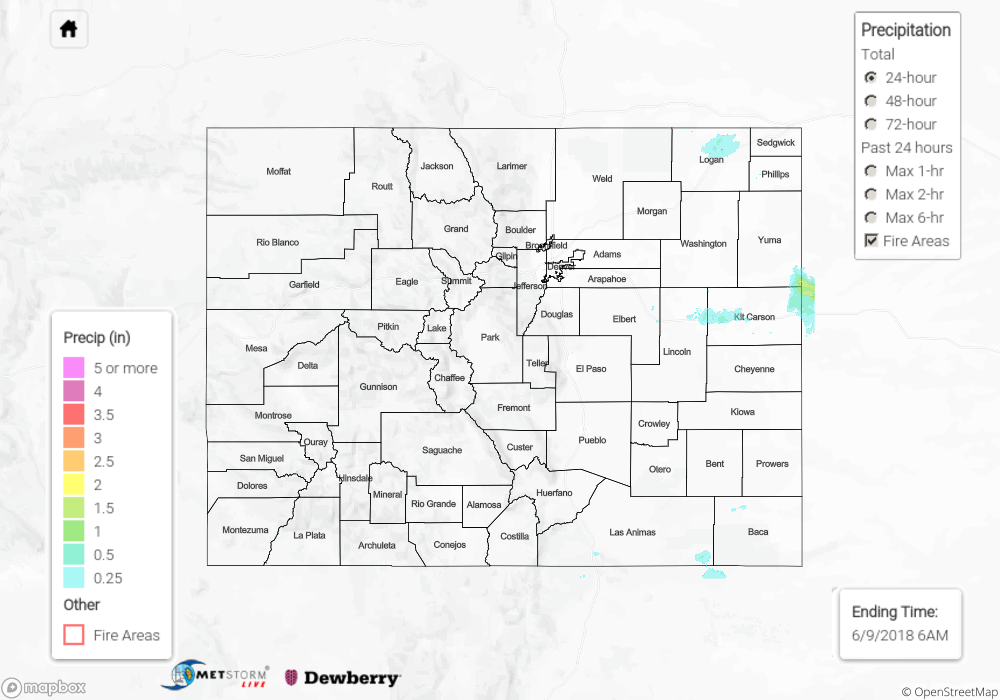
Flooding was not reported on Friday. For rainfall estimates over your area, scroll down to the State Precipitation Map below.
Click Here For Map Overview
Note: We have identified a possible underestimation in QPE over the southwest part of the state. We are working to on this issue, and will provide an update as soon as possible.