SPM 06-16-2018: A Final Day of Gusty Showers before the Main Show of Rainfall

Issue Date: Saturday, June 16th, 2018
Issue Time: 9:30 AM MDT

Summary:

Plenty of mid-level moisture blanketed the state yesterday to support scattered, high-based showers and thunderstorms. Activity over the High Country was garden-variety, producing more gusty winds than rain as the low-levels remained too dry for much wetting rainfall. The peak of shower/storm coverage occurred during the late afternoon and into the evening hours, with activity tapering off by midnight. A second wave of showers encroached on western Colorado during the overnight hours thanks to Bud’s remnants beginning to encroach on the area and an increase in upper-level support from the approaching upper-level trough. These features will set the stage for today’s FTB forecast.

East of the mountains, just as over the High Country, dry air in the lower levels kept most storms from producing much in the way of rainfall. However, the presence of a stalled frontal boundary over the Northeast Plains allowed a bit better moisture to creep into that portion of the state, which supported a few stronger thunderstorms with periods of light-to-moderate rainfall during the evening hours.

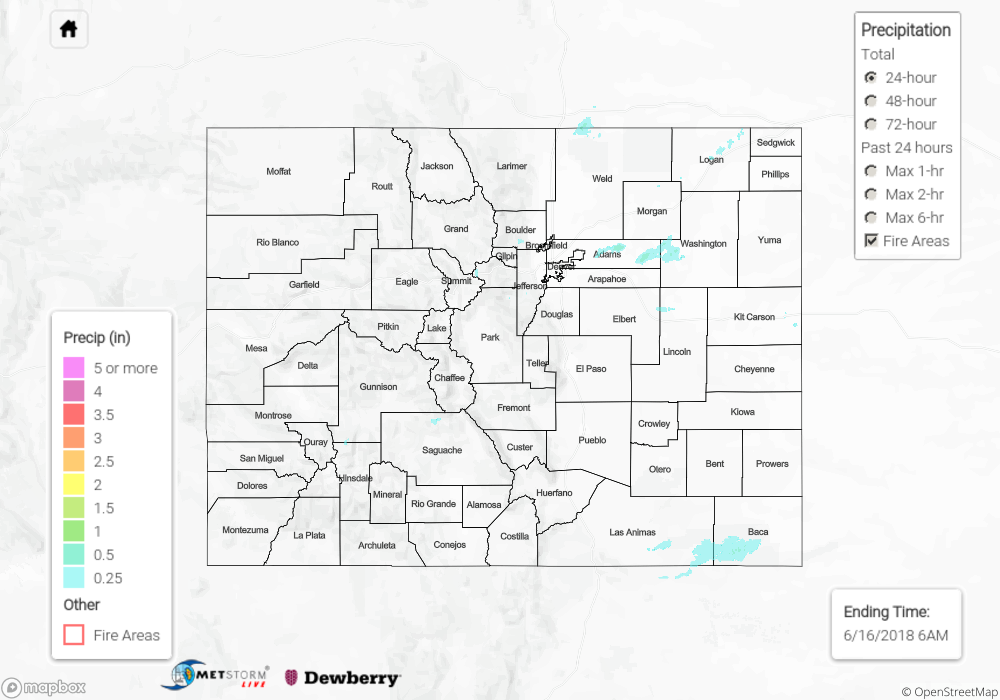
No flash flooding was reported on Friday. For a look at precipitation estimates in your area, please see our State Precipitation Map below.

Click Here For Map Overview

The map below shows radar-estimated, rainfall gage-adjusted Quantitative Precipitation Estimates (QPE) across Colorado. The map is updated daily during the operational season (May 1 – Sep 30) by 11AM. The following six layers are currently available: 24-hour, 48-hour and 72-hour total precipitation, as well as maximum 1-hour, 2-hour and 6-hour precipitation over the past 24 hour period (to estimate where flash flooding may have occurred). The 24-hour, 48-hour and 72-hour total precipitation contain bias corrections that are not disaggregated into the hourly estimates, so there will likely be some differences. The accumulation ending time is 6AM of the date shown in the bottom right corner. Also shown optionally are fire burn areas (post 2012), which are updated throughout the season to include new burn areas. The home button in the top left corner resets the map to the original zoom.

Note: We have identified a possible underestimation in QPE over the southwest part of the state. We are working to on this issue, and will provide an update as soon as possible.

SPM 06-15-2018: Gusty Thunderstorms with Minimal Rainfall

Issue Date: Friday, June 15, 2018
Issue Time: 10:55AM MDT

Summary:

Mid-level cloud cover increased quite a bit yesterday as the subtropical moisture started making its way into the state. This was all thanks to the help of the west coast trough and high pressure over New Mexico drawing the remaining moisture of Bud north. The low levels remained a bit too dry yesterday for higher rainfall totals. With dew points in the 30-40F range, inverted-V soundings produced very gusty winds under the cores. Gusts of 50-55 mph were recorded across the state. In Craig, a downburst knocked down a couple of power lines and a transformer. Over Kit Carson, blowing dust temporarily reduced visibility to under 1 mile.

As far as rainfall totals, the big winner yesterday was over Las Animas County where radar estimated totals just over 1 inch. A CoCoRaHS station south of Kim recorded 0.32 inches of rain. Not much precipitation was to be had over the San Juan Burn areas, rather gusty winds and lightning brought critical fire danger to the area. Currently the Burro fire has burned 3,400 acres and the 416 fire has burned 33,000 acres. The low-levels are expected to become more moist this evening over the southwest corner, which will allow rainfall to start reaching the ground. Totals over this region yesterday were estimated to be under 0.25 inches.

No flooding was reported on Thursday. To see how much precipitation fell across your neighborhood, scroll down to the State Precipitation Map below. Note: we’re having a few technical difficulties with MetStorm Live QPE data this morning, so we have used the MRMS bias corrected QPE instead.

Storm Total Precip Legend

SPM 06-14-2018: Scattered Thunderstorms Rumbled Across Eastern Colorado

Issue Date: Thursday, June 14th, 2018
Issue Time: 9:30 AM MDT

Summary:

The battle between dry air and moist air was waged yesterday. West of the Continental Divide, dry air claimed victory as skies remained mostly sunny and hot temperatures ruled the day. Grand Junction set a high temperature record, reaching 101 degrees! A couple high-based showers/thunderstorms tried to develop over the higher terrain of the San Juan Mountains and Southwest Slope, but too much dry air foiled them before they could produce any rainfall. This morning, there are plenty of mid-/upper-level clouds across the High Country, thanks to a subtle increase in moisture during the overnight hours from the southwest.

To the east of the Continental Divide, low-level moisture and daytime heating were sufficient enough to trigger scattered thunderstorms during the afternoon and evening hours. Most produced more wind than rain as dry air in the mid-levels zapped some of their heavy rainfall potential. A couple storms were strong-to-severe, producing hail 0.5 inch-1 inch in diameter.

No flash flooding was reported yesterday. For a look at precipitation estimates in your area, please see our State Precipitation Map below.

Click Here For Map Overview

The map below shows radar-estimated, rainfall gage-adjusted Quantitative Precipitation Estimates (QPE) across Colorado. The map is updated daily during the operational season (May 1 – Sep 30) by 11AM. The following six layers are currently available: 24-hour, 48-hour and 72-hour total precipitation, as well as maximum 1-hour, 2-hour and 6-hour precipitation over the past 24 hour period (to estimate where flash flooding may have occurred). The 24-hour, 48-hour and 72-hour total precipitation contain bias corrections that are not disaggregated into the hourly estimates, so there will likely be some differences. The accumulation ending time is 6AM of the date shown in the bottom right corner. Also shown optionally are fire burn areas (post 2012), which are updated throughout the season to include new burn areas. The home button in the top left corner resets the map to the original zoom.

Note: We have identified a possible underestimation in QPE over the southwest part of the state. We are working to on this issue, and will provide an update as soon as possible.

SPM 06-13-2018: Overnight Thunderstorms Rumbled East of the Mountains

Issue Date: Wednesday, June 13th, 2018
Issue Time: 10:20 AM MDT

Summary:

All was mainly quiet across Colorado yesterday during the daylight hours, with high pressure ridging and sunshine dominating the state. As the day turned to night and early morning, a surge of moisture from the southeast invaded eastern Colorado and kicked off isolated thunderstorms across portions of the Urban Corridor, Palmer Ridge, Northeast Plains, Southeast Plains, and Raton Ridge. Most were run-of-the-mill, producing plenty of lightning, periods of light-to-moderate rainfall, gusty winds, and small hail. However, one storm was able to outperform the rest, bringing large hail to El Paso County between Midnight and 2:00 AM. Take a look at some of the larger hail reports from this isolated storm:

– 3.00 inch diameter hail: 3 miles WSW Peterson AFB
– 2.50 inch diameter hail: Fountain, 2 miles NE of Fountain
– 2.00 inch diameter hail: 2 miles SE of Security, 2 miles WSW Peterson AFB
– 1.75 inch diameter hail: Fountain
– 1.50 inch diameter hail: 3 miles ESE of Security, 3 miles W Peterson AFB
– Plus a handful of 1 inch and 1.25 inch reports.

No flash flooding was reported yesterday. For a look at precipitation estimates in your area, please see our State Precipitation Map below.

Click Here For Map Overview

The map below shows radar-estimated, rainfall gage-adjusted Quantitative Precipitation Estimates (QPE) across Colorado. The map is updated daily during the operational season (May 1 – Sep 30) by 11AM. The following six layers are currently available: 24-hour, 48-hour and 72-hour total precipitation, as well as maximum 1-hour, 2-hour and 6-hour precipitation over the past 24 hour period (to estimate where flash flooding may have occurred). The accumulation ending time is 6AM of the date shown in the bottom right corner. Also shown optionally are fire burn areas since 2012. The home button in the top left corner resets the map to the original zoom.

Note: We have identified a possible underestimation in QPE over the southwest part of the state. We are working to on this issue, and will provide an update as soon as possible.