SPM 08-15-2018: Flooding Near La Veta Pass with Heavy Rainfall into the Evening Hours

Issue Date: Wednesday, August 15th, 2018
Issue Time: 10:00 AM MDT

Summary:

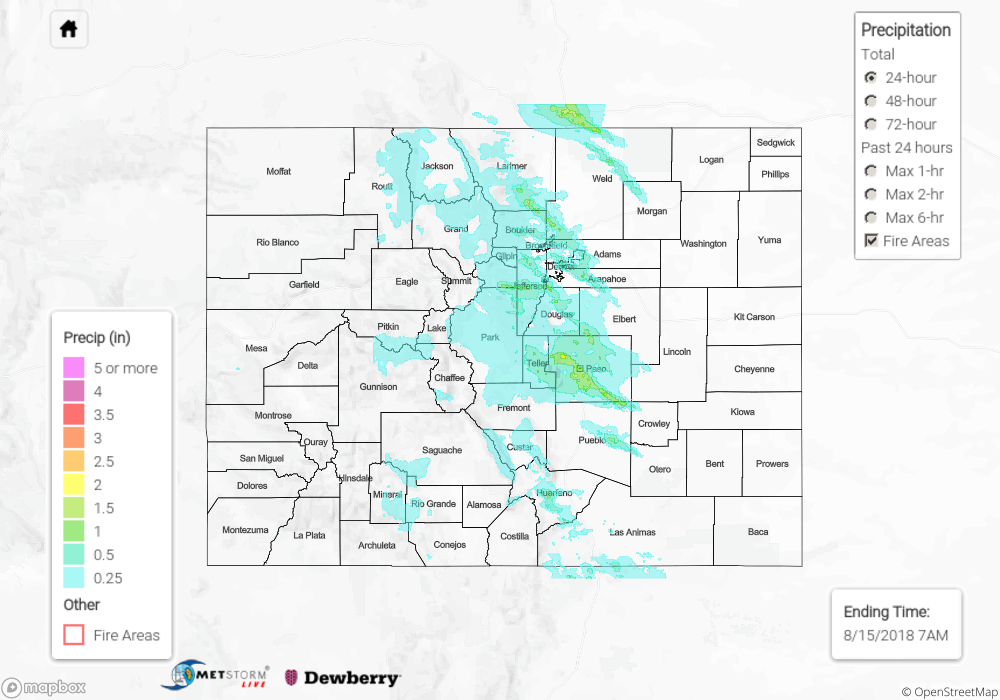
A shortwave trough passed over the eastern mountains at the same time as peak heating on Tuesday, which help create widespread thunderstorm development. Storm development was greatest over the Front Range, but better moisture was to the south. The low pressure that had been creating northeasterly flow aloft moved into Kansas, so south/southeast winds pulled low-level moisture back into eastern Colorado. Dew points yesterday afternoon were in the low 50Fs to the north and the high 50Fs to the south. This helped create some heavy rainfall in the afternoon and overnight hours along with strong winds and hail up to 1.5 inches in diameter during the afternoon. Most hail yesterday was in the pea size range, but drifts of 3-4 feet were reported on social media. This caused a lot of problems with drainage, so roads had a lot of flooding with the storms to the north. To the west, residual moisture under the ridge was reused for afternoon thunderstorms, but without much change to the low-level moisture, storm totals were similar to the last couple of days. A gust of 53 mph was measured as Pitkin County Airport.

Here are some of the heaviest rainfall reports from Tuesday (from North to South):
1.45 inches near Chatfield State Park and Buckley Air Force Base
0.95 inches 3 miles east of Monument
1.34 inches at the Air Force Academy
1.51 inches near Security-Widefield
1.64 inches at Peterson AFB

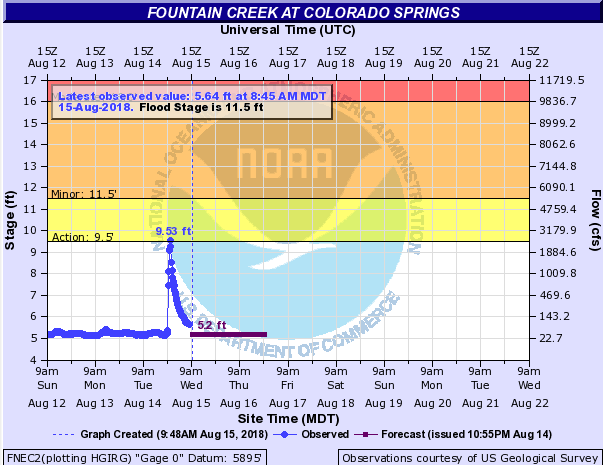
Fountain Creek at Colorado Springs reached the Action stage with a height of 9.53 inches. That’s a 4.5 foot rise in the span of an hour or two, which is always impressive. A slow moving thunderstorm produced flash flooding near La Veta Pass. Flooding was reported at County Road 442 at south Abeyta Creek. There was also flooding reported over County Road 520 at Dog Springs Arroyo. Radar estimates were just over 1 inch in this area.

To see how much precipitation fell over your area, scroll down to the State Precipitation Map below.

Click Here For Map Overview

The map below shows radar-estimated, rainfall gage-adjusted Quantitative Precipitation Estimates (QPE) across Colorado. The map is updated daily during the operational season (May 1 – Sep 30) by 11AM. The following six layers are currently available: 24-hour, 48-hour and 72-hour total precipitation, as well as maximum 1-hour, 2-hour and 6-hour precipitation over the past 24 hour period (to estimate where flash flooding may have occurred). The 24-hour, 48-hour and 72-hour total precipitation contain bias corrections that are not disaggregated into the hourly estimates, so there will likely be some differences. The accumulation ending time is 7AM of the date shown in the bottom right corner. Also shown optionally are fire burn areas (post 2012), which are updated throughout the season to include new burn areas. The home button in the top left corner resets the map to the original zoom.

SPM 08-14-2018: Another afternoon of Garden Variety Thunderstorms for Western Colorado

Issue Date: Tuesday, August 14th, 2018
Issue Time: 10:10 AM MDT

Summary:

Persistent pattern again yesterday as trapped moisture under the ridge was recycled to help initiate thunderstorm activity over the western high terrains in the afternoon. A passing shortwave over the northwest corner of the state increased coverage over the Northern Mountains. Without ample moisture further north, precipitation totals yesterday were limited and storms produced mostly virga and gusty winds. Most of the lower valleys received only a trace of rainfall. Local storm reports in the area from ASOS and observers reported thunderstorm gusts up to 45 mph. Over southern Colorado, totals increased as there was a bit more moisture to work with. The highest observation of the day was in La Plata County where a CoCoRaHS station recorded 0.6 inches in Bayfield. Small hail was also reported with this thunderstorm. Most other rainfall gages were in the 0.2 to 0.3 inch range. Over the Southeast Plains, some thunderstorms kicked off overnight along a line of convergence on the west side of low pressure system that is now in Kansas. Totals were estimated by radar to be up to 0.5 inches. Flooding was not reported on Monday.

To see how much precipitation fell over your area the last 72-hours, scroll down to the State Precipitation Map below.

Click Here For Map Overview

The map below shows radar-estimated, rainfall gage-adjusted Quantitative Precipitation Estimates (QPE) across Colorado. The map is updated daily during the operational season (May 1 – Sep 30) by 11AM. The following six layers are currently available: 24-hour, 48-hour and 72-hour total precipitation, as well as maximum 1-hour, 2-hour and 6-hour precipitation over the past 24 hour period (to estimate where flash flooding may have occurred). The 24-hour, 48-hour and 72-hour total precipitation contain bias corrections that are not disaggregated into the hourly estimates, so there will likely be some differences. The accumulation ending time is 7AM of the date shown in the bottom right corner. Also shown optionally are fire burn areas (post 2012), which are updated throughout the season to include new burn areas. The home button in the top left corner resets the map to the original zoom.

SPM 08-13-2018: Afternoon Showers and Thunderstorms returned to the Central and San Juan Mountains

Issue Date: Monday, August 13th, 2018
Issue Time: 09:30 AM MDT

Summary:

Residual moisture under the ridge helped kick off some thunderstorms over the Central and San Juan Mountains on Sunday. Highest moisture was further south, thus storms to the north produced gusty winds and rainfall totals under 0.1 inches. A few storms even drifted into the San Luis Valley. CoCoRaHS stations in Alamosa recorded up to 0.21 inches with totals up to 0.25 inches in the area. Further west, a CoCoRaHS gage near Purgatory Ski Resort recorded 0.35 inches with a nearby SNOTEL (Cascade) recording 0.6 inches. Sharkstooth SNOTEL (near Burro Mountain) recorded 0.5 inches, and a CoCoRaHS near Dolores recorded 0.79 inches. A Flash Flood Warning was issued for northeast Montezuma County for this thunderstorm since it tracked over the recent burn scars, but no flooding was reported as of this morning. Small hail was also reported in this area with a storm report of 0.75 inch diameter hail coming from Dolores.

To see how much precipitation fell over your area the last 72-hours, scroll down to the State Precipitation Map below.

Click Here For Map Overview

The map below shows radar-estimated, rainfall gage-adjusted Quantitative Precipitation Estimates (QPE) across Colorado. The map is updated daily during the operational season (May 1 – Sep 30) by 11AM. The following six layers are currently available: 24-hour, 48-hour and 72-hour total precipitation, as well as maximum 1-hour, 2-hour and 6-hour precipitation over the past 24 hour period (to estimate where flash flooding may have occurred). The 24-hour, 48-hour and 72-hour total precipitation contain bias corrections that are not disaggregated into the hourly estimates, so there will likely be some differences. The accumulation ending time is 7AM of the date shown in the bottom right corner. Also shown optionally are fire burn areas (post 2012), which are updated throughout the season to include new burn areas. The home button in the top left corner resets the map to the original zoom.

SPM 08-12-2018: Largely Dry, but Fortunately no New Fires Either

Issue Date: Sunday, August 12th, 2018
Issue Time: 09:50 AM MDT

Summary:

Very little precipitation was reported across the whole of Colorado yesterday, with just isolated shower and thunderstorm activity reported across the Elk Mountains and San Juan Mountains. In fact, our top two credible rainfall reports from yesterday were just 0.2” at two low-resolution SNOTEL sites, Stump Lakes (La Plata County) and Sharkstooth (Montezuma County). Not a single CoCoRaHS observer statewide reported more than 0.03” of rain yesterday. Fortunately, however, no new significant fire incidents were reported yesterday either, which is lucky given the likelihood of some scattered dry lightning across the southern mountains yesterday. We’ll be monitoring both rainfall and dry lightning across portions of the state again today.

To see how much precipitation fell over your area yesterday, scroll down to the State Precipitation Map below.

Click Here For Map Overview

The map below shows radar-estimated, rainfall gage-adjusted Quantitative Precipitation Estimates (QPE) across Colorado. The map is updated daily during the operational season (May 1 – Sep 30) by 11AM. The following six layers are currently available: 24-hour, 48-hour and 72-hour total precipitation, as well as maximum 1-hour, 2-hour and 6-hour precipitation over the past 24 hour period (to estimate where flash flooding may have occurred). The 24-hour, 48-hour and 72-hour total precipitation contain bias corrections that are not disaggregated into the hourly estimates, so there will likely be some differences. The accumulation ending time is 6AM of the date shown in the bottom right corner. Also shown optionally are fire burn areas (post 2012), which are updated throughout the season to include new burn areas. The home button in the top left corner resets the map to the original zoom.