Issue Date: Tuesday, August 14th, 2018
Issue Time: 10:10 AM MDT
Summary:
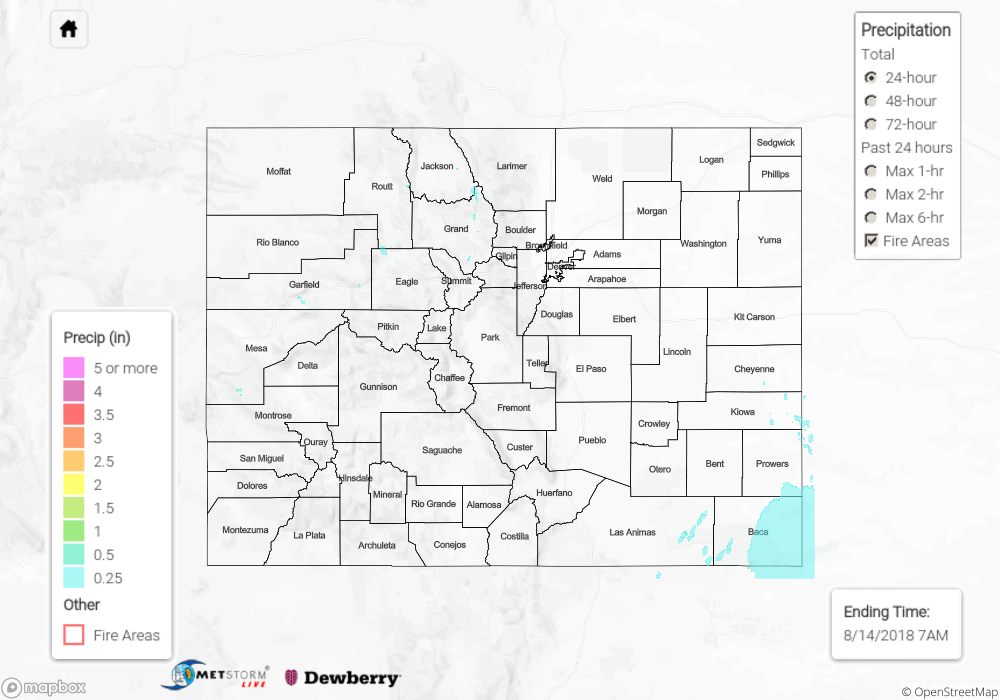
Persistent pattern again yesterday as trapped moisture under the ridge was recycled to help initiate thunderstorm activity over the western high terrains in the afternoon. A passing shortwave over the northwest corner of the state increased coverage over the Northern Mountains. Without ample moisture further north, precipitation totals yesterday were limited and storms produced mostly virga and gusty winds. Most of the lower valleys received only a trace of rainfall. Local storm reports in the area from ASOS and observers reported thunderstorm gusts up to 45 mph. Over southern Colorado, totals increased as there was a bit more moisture to work with. The highest observation of the day was in La Plata County where a CoCoRaHS station recorded 0.6 inches in Bayfield. Small hail was also reported with this thunderstorm. Most other rainfall gages were in the 0.2 to 0.3 inch range. Over the Southeast Plains, some thunderstorms kicked off overnight along a line of convergence on the west side of low pressure system that is now in Kansas. Totals were estimated by radar to be up to 0.5 inches. Flooding was not reported on Monday.
To see how much precipitation fell over your area the last 72-hours, scroll down to the State Precipitation Map below.
Click Here For Map Overview