SPM 09-04-2018: Heavy Rainfall for the Southeast Plains

Issue Date: Tuesday, September 4th, 2018
Issue Time: 09:20 AM MDT

Summary:

Cool start to Labor Day with a lot of upper-level clouds over the state. An upper-level low over the four corners region helped promote some of the morning rainfall over the southern high terrains. That circulation slowly moved the northeast throughout the day and help provide lift for widespread showers over the southern portion of the state with the upslope flow. Southern San Miguel County had a CoCoRaHS station report 0.37 inches with radar estimates just under 1 inch near the area. Most other areas over the western high terrains recorded between 0.1 and 0.4 inches with storm coverage becoming more isolated north. Some gusty outflow winds also occurred, and Garfield Regional Airport reported a gust of 32 mph around 4PM.

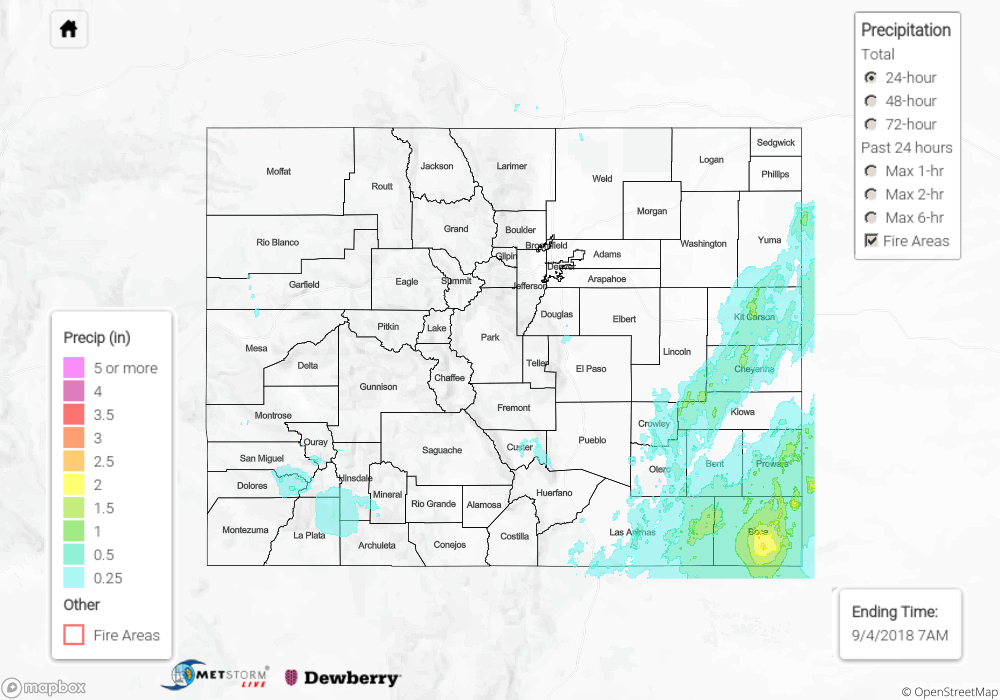
Over the eastern high terrains, rainfall was greatest over the Southeast Mountains. Totals on Monday were under 0.5 inches. High moisture over the eastern plains gave way to some strong storms and heavy rainfall after considerable clearing from the morning’s cloud cover. In Lincoln County, a CoCoRaHS station north of Haswell recorded 2.3 inches. By far the heaviest rainfall for the 24-hour period occurred over southern Prowers, eastern Las Animas and Baca County. A CoCoRaHS station in Baca County near Campo recorded 2.52 inches for the day. Radar max 1-hour radar estimates were 1.5 – 2 inches with estimates just over 2.5 inches for the 24-hour period. Despite quite the soaking and a small increase in the Arkansas River gage at Coolidge (1 foot), no flooding was reported as of Tuesday morning.

To see how much precipitation fell over your area yesterday, scroll down to the State Precipitation Map below.

Click Here For Map Overview

The map below shows radar-estimated, rainfall gage-adjusted Quantitative Precipitation Estimates (QPE) across Colorado. The map is updated daily during the operational season (May 1 – Sep 30) by 11AM. The following six layers are currently available: 24-hour, 48-hour and 72-hour total precipitation, as well as maximum 1-hour, 2-hour and 6-hour precipitation over the past 24 hour period (to estimate where flash flooding may have occurred). The 24-hour, 48-hour and 72-hour total precipitation contain bias corrections that are not disaggregated into the hourly estimates, so there will likely be some differences. The accumulation ending time is 7AM of the date shown in the bottom right corner. Also shown optionally are fire burn areas (post 2012), which are updated throughout the season to include new burn areas. The home button in the top left corner resets the map to the original zoom.


SPM 09-03-2018: Rainfall Returns to Southern Colorado

Issue Date: Monday, September 3rd, 2018
Issue Time: 09:38 AM MDT

Summary:

The upper-level low to our southwest drifted into the four corners region on Sunday and continued to promote thunderstorm and shower activity. Low-level moisture increased over eastern Colorado, which allowed more scattered storms to form over the adjacent plains near the Southeast Mountains. However, the higher moisture remained south and east of the state, so precipitation totals yesterday were under 1 inch. With a little bit of instability, some stronger storms formed over the San Juan Mountains, and small hail (0.25 inches) was reported near Hesperus, CO. Several CoCoRaHS stations in northern Rio Grande County reported rainfall in the 0.75 to 1 inch range for the 24-hour period. Even the San Luis Valley was able to get some light rain as rainfall continued over the Southeast Mountains overnight. Over the eastern, adjacent plains totals estimated by radar were up to 0.5 inches. Flooding was not reported on Sunday.

To see how much precipitation fell over your area yesterday, scroll down to the State Precipitation Map below.

Click Here For Map Overview

The map below shows radar-estimated, rainfall gage-adjusted Quantitative Precipitation Estimates (QPE) across Colorado. The map is updated daily during the operational season (May 1 – Sep 30) by 11AM. The following six layers are currently available: 24-hour, 48-hour and 72-hour total precipitation, as well as maximum 1-hour, 2-hour and 6-hour precipitation over the past 24 hour period (to estimate where flash flooding may have occurred). The 24-hour, 48-hour and 72-hour total precipitation contain bias corrections that are not disaggregated into the hourly estimates, so there will likely be some differences. The accumulation ending time is 7AM of the date shown in the bottom right corner. Also shown optionally are fire burn areas (post 2012), which are updated throughout the season to include new burn areas. The home button in the top left corner resets the map to the original zoom.

SPM 09-02-2018: Scattered Showers and Thunderstorms Dotted Colorado

Issue Date: Sunday, September 2nd, 2018
Issue Time: 9:30 AM MDT

Summary:

A meandering upper-level low near the 4-corners region sent a couple weak disturbances across Colorado yesterday, triggering scattered showers and thunderstorms across the state. Generally speaking, the main plume of moisture resided well above the surface, with drier air beneath it, resulting in activity that produced gusty winds and periods of light-to-moderate rainfall. A couple storms were on the strong-to-marginally severe side east of I-25, but even these did not result in any flash flooding issues. The lone storm report of the day came from southwest Colorado, where 0.5 inch hail was reported with a stronger thunderstorm located 3 miles N of Mesa Verde National Park (Montezuma County).

No flash flooding was reported yesterday. For a look at precipitation estimates in your area, please see the State Precipitation Map below.

Click Here For Map Overview

The map below shows radar-estimated, rainfall gage-adjusted Quantitative Precipitation Estimates (QPE) across Colorado. The map is updated daily during the operational season (May 1 – Sep 30) by 11AM. The following six layers are currently available: 24-hour, 48-hour and 72-hour total precipitation, as well as maximum 1-hour, 2-hour and 6-hour precipitation over the past 24 hour period (to estimate where flash flooding may have occurred). The 24-hour, 48-hour and 72-hour total precipitation contain bias corrections that are not disaggregated into the hourly estimates, so there will likely be some differences. The accumulation ending time is 7AM of the date shown in the bottom right corner. Also shown optionally are fire burn areas (post 2012), which are updated throughout the season to include new burn areas. The home button in the top left corner resets the map to the original zoom.

SPM 09-01-2018: Scattered High-Based Showers and Thunderstorms

Issue Date: Saturday, September 1st, 2018
Issue Time: 9:30 AM MDT

Summary:

The stubborn upper-level high that resulted in dry, hot conditions throughout the week finally shifted east yesterday, allowing the return of mid-level moisture to Colorado from the west/southwest. This mid-level moisture was enough to fuel scattered showers and thunderstorms across the state during the afternoon and evening hours, with a few spotty showers continuing into this morning. The impact of this activity was more wind than rain, as the near-surface air remained relatively dry, evaporating much of the rainfall before it reached the ground. Most locations that experienced rainfall received less than 0.1 inches, with a few locally higher totals east of I-25 where better low-level moisture resided and multiple rounds of showers/thunderstorms moved overhead. As far as storm reports are concerned, the only strong thunderstorm wind gust that was reported came from Yampa Valley Airport (Routt County), where a 54 mph wind gust was reported yesterday afternoon.

No flash flooding was reported yesterday. For a look at precipitation estimates in your area, please see the State Precipitation Map below.

Click Here For Map Overview

The map below shows radar-estimated, rainfall gage-adjusted Quantitative Precipitation Estimates (QPE) across Colorado. The map is updated daily during the operational season (May 1 – Sep 30) by 11AM. The following six layers are currently available: 24-hour, 48-hour and 72-hour total precipitation, as well as maximum 1-hour, 2-hour and 6-hour precipitation over the past 24 hour period (to estimate where flash flooding may have occurred). The 24-hour, 48-hour and 72-hour total precipitation contain bias corrections that are not disaggregated into the hourly estimates, so there will likely be some differences. The accumulation ending time is 7AM of the date shown in the bottom right corner. Also shown optionally are fire burn areas (post 2012), which are updated throughout the season to include new burn areas. The home button in the top left corner resets the map to the original zoom.