Issue Date: Tuesday, September 4th, 2018
Issue Time: 09:20 AM MDT
Summary:
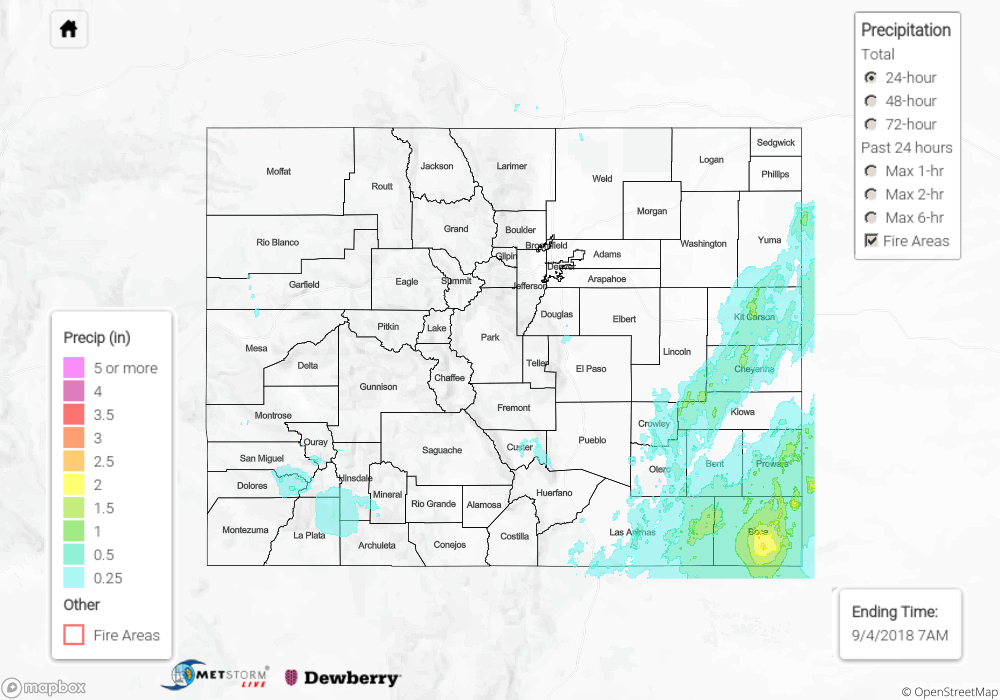
Cool start to Labor Day with a lot of upper-level clouds over the state. An upper-level low over the four corners region helped promote some of the morning rainfall over the southern high terrains. That circulation slowly moved the northeast throughout the day and help provide lift for widespread showers over the southern portion of the state with the upslope flow. Southern San Miguel County had a CoCoRaHS station report 0.37 inches with radar estimates just under 1 inch near the area. Most other areas over the western high terrains recorded between 0.1 and 0.4 inches with storm coverage becoming more isolated north. Some gusty outflow winds also occurred, and Garfield Regional Airport reported a gust of 32 mph around 4PM.
Over the eastern high terrains, rainfall was greatest over the Southeast Mountains. Totals on Monday were under 0.5 inches. High moisture over the eastern plains gave way to some strong storms and heavy rainfall after considerable clearing from the morning’s cloud cover. In Lincoln County, a CoCoRaHS station north of Haswell recorded 2.3 inches. By far the heaviest rainfall for the 24-hour period occurred over southern Prowers, eastern Las Animas and Baca County. A CoCoRaHS station in Baca County near Campo recorded 2.52 inches for the day. Radar max 1-hour radar estimates were 1.5 – 2 inches with estimates just over 2.5 inches for the 24-hour period. Despite quite the soaking and a small increase in the Arkansas River gage at Coolidge (1 foot), no flooding was reported as of Tuesday morning.
To see how much precipitation fell over your area yesterday, scroll down to the State Precipitation Map below.
Click Here For Map Overview
The map below shows radar-estimated, rainfall gage-adjusted Quantitative Precipitation Estimates (QPE) across Colorado. The map is updated daily during the operational season (May 1 – Sep 30) by 11AM. The following six layers are currently available: 24-hour, 48-hour and 72-hour total precipitation, as well as maximum 1-hour, 2-hour and 6-hour precipitation over the past 24 hour period (to estimate where flash flooding may have occurred). The 24-hour, 48-hour and 72-hour total precipitation contain bias corrections that are not disaggregated into the hourly estimates, so there will likely be some differences. The accumulation ending time is 7AM of the date shown in the bottom right corner. Also shown optionally are fire burn areas (post 2012), which are updated throughout the season to include new burn areas. The home button in the top left corner resets the map to the original zoom.
