SPM 09-20-2018: Moisture Plume and Upper Dynamics Combine for Beneficial Rainfall

Issue Date: Thursday, September 20th, 2018
Issue Time: 10:05 AM MDT

Summary:

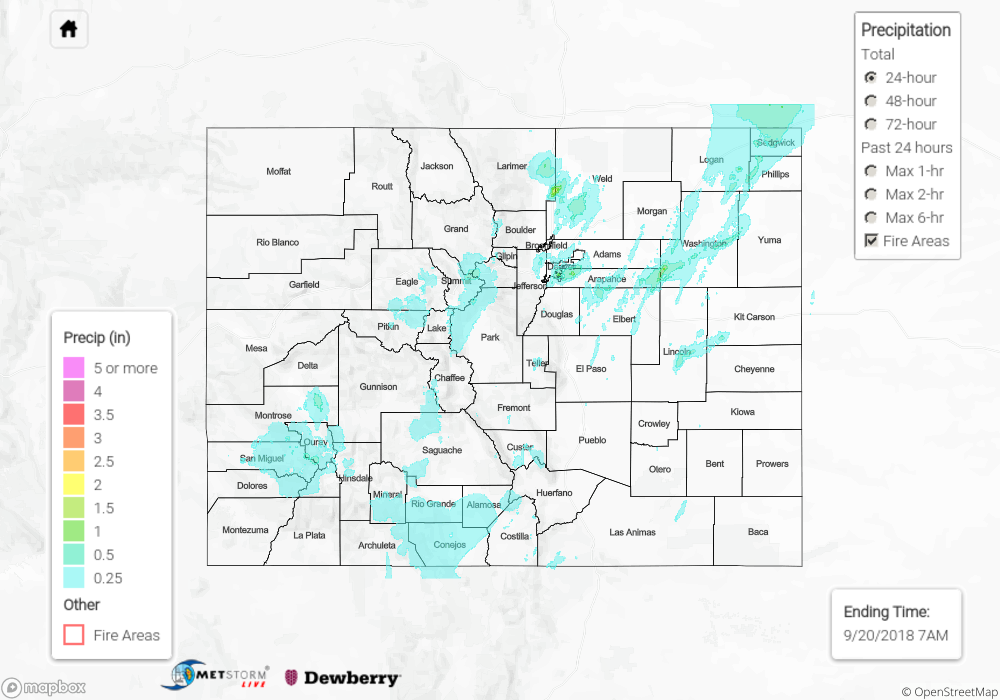
Quite an active weather day across the state yesterday. As the trough began to move eastward, a moisture plume was pulled northward into the state. With support of upper-level dynamics, including a cold front over eastern Colorado, widespread showers and thunderstorms returned to the forecast on Wednesday. Showers started over the southwest corner of the state and spread northward creating a line of storms oriented from southwest to northeast. Storms over western Colorado were generally lighter as not as much instability was able to build with storms starting during the late morning. Nonetheless, there was some beneficial rainfall for the San Juan and Central Mountains. Generally, totals were between 0.25 and 0.5 inches with lower elevations recording up to 0.1 inches. Even the San Luis Valley got some rainfall. Alamosa recorded around 0.5 inches with a CoCoRaHS station near San Luis recording 0.16 inches.

Over the eastern mountains, totals were greatest over the Front Range. As the storms moved into the adjacent plains (Urban Corridor) they encountered some decent instability and moisture. The Fort Collins Mesonet recorded its highest 24-hour value near Windsor, which was just over 1 inch. Radar rainfall estimates were just over 1.5 inches in the area due to CoCoRaHS stations in the area reporting 2.21 and 1.53 inches. There was some small hail reported with this storm, so we will look into these values as hail contamination might have occurred. Over Denver, the ALERT system had a 24-hour value of 1.26 inches at the Murphy Creek Golf Course site in Aurora. Totals over the metro area were mostly in the 0.3 to 0.7 inch range and produced a nice spike at the Cherry Creek gage (below). An areal flood advisory was issued for southeast Denver, Aurora and Centennial but there were no flood reports as of this morning. Over the eastern plains, storms became severe with a tornado warning in Kit Carson/Cheyenne Counties. Although the storm was capable of producing a tornado, there were no reports of a tornado as of this morning. Rainfall totals just over an inch were reported with these storms.

To see how much rain fell over your area yesterday, scroll down to the State Precipitation Map below.

Click Here For Map Overview

The map below shows radar-estimated, rainfall gage-adjusted Quantitative Precipitation Estimates (QPE) across Colorado. The map is updated daily during the operational season (May 1 – Sep 30) by 11AM. The following six layers are currently available: 24-hour, 48-hour and 72-hour total precipitation, as well as maximum 1-hour, 2-hour and 6-hour precipitation over the past 24 hour period (to estimate where flash flooding may have occurred). The 24-hour, 48-hour and 72-hour total precipitation contain bias corrections that are not disaggregated into the hourly estimates, so there will likely be some differences. The accumulation ending time is 7AM of the date shown in the bottom right corner. Also shown optionally are fire burn areas (post 2012), which are updated throughout the season to include new burn areas. The home button in the top left corner resets the map to the original zoom.

SPM 09-19-2018: Hot Temperatures Continue

Issue Date: Wednesday, September 19th, 2018
Issue Time: 10:10 AM MDT

Summary:

Tuesday was another day with dry conditions and hot temperatures. High temperatures at the lower elevations reached the 90F mark once again with Lamar reaching 100F. The jet sagged southward and promoted some decent surface winds over the Northwest Slope. A Red Flag Warning was issued at 10AM through the evening hours as conditions promoted critical fire weather. Thankfully no new fires were started as crews have their hands full with the Ryan and Silver Creek fires. Some fair weather cumulus popped up in the afternoon hours, which helped provide a little shade form the heat. With very dry low-levels in the atmosphere, there was no rainfall recorded in Colorado yesterday.

Once again, nothing to see on the State Precipitation Map below.

Click Here For Map Overview

The map below shows radar-estimated, rainfall gage-adjusted Quantitative Precipitation Estimates (QPE) across Colorado. The map is updated daily during the operational season (May 1 – Sep 30) by 11AM. The following six layers are currently available: 24-hour, 48-hour and 72-hour total precipitation, as well as maximum 1-hour, 2-hour and 6-hour precipitation over the past 24 hour period (to estimate where flash flooding may have occurred). The 24-hour, 48-hour and 72-hour total precipitation contain bias corrections that are not disaggregated into the hourly estimates, so there will likely be some differences. The accumulation ending time is 7AM of the date shown in the bottom right corner. Also shown optionally are fire burn areas (post 2012), which are updated throughout the season to include new burn areas. The home button in the top left corner resets the map to the original zoom.

SPM 09-18-2018: The Heat Streak Continues

Issue Date: Tuesday, September 18th, 2018
Issue Time: 09:00 AM MDT

Summary:

Another repetitive SPM post as little changed in the upper-level pattern yesterday. Temperatures reached 90F at the lower elevations again, so that can be added to the tally of 90F+ days for the season. Some mid-level moisture streamed in with a shortwave, which helped provide some afternoon cloud cover and a few light showers over the northern high terrains. Trace amounts of rainfall and totals up to 0.05 inches were reported over the Northern Mountains and Front Range. A 60 mph wind gust was reported in Moffat County near Craig from a thunderstorm, which was likely not helpful for firefighters. There were also some light showers associated with the shortwave as it moved along the CO/WY border. Totals up to 0.25 inches were reported over Sedgwick County. It will only be a couple more days before fall starts and some fall-like temperatures make it into the forecast. I think everyone will welcome the break from the heat and dry at this point. It will also help fight the 10 fires burning across the state, especially the Ryan and Silver Creek Fires.

Once again, nothing to see on the State Precipitation Map below.

Click Here For Map Overview

The map below shows radar-estimated, rainfall gage-adjusted Quantitative Precipitation Estimates (QPE) across Colorado. The map is updated daily during the operational season (May 1 – Sep 30) by 11AM. The following six layers are currently available: 24-hour, 48-hour and 72-hour total precipitation, as well as maximum 1-hour, 2-hour and 6-hour precipitation over the past 24 hour period (to estimate where flash flooding may have occurred). The 24-hour, 48-hour and 72-hour total precipitation contain bias corrections that are not disaggregated into the hourly estimates, so there will likely be some differences. The accumulation ending time is 7AM of the date shown in the bottom right corner. Also shown optionally are fire burn areas (post 2012), which are updated throughout the season to include new burn areas. The home button in the top left corner resets the map to the original zoom.

SPM 09-17-2018: Rounding Out the Weekend with yet another Hot, Dry Day

Issue Date: Monday, September 17th, 2018
Issue Time: 09:10 AM MDT

Summary:

I guess you can say that we’re still in the dog days of summer with the multiple days of 90F+ heat. It’s hard to believe that fall is beginning at the end of this week. A bit more mid-level moisture streamed into the state yesterday, which helped bring some increased cloud cover and welcomed shade from the heat. With such dry low-levels in the atmosphere, only trace amounts of rain (sprinkles, really) reached the surface in a very patch pattern. However, the increased moisture did bring some relief to fire weather in western and north-central Colorado. Red Flag Warning criteria was not quite met, which helped fight the ongoing fires. Northwest Colorado is currently fighting five wildfires: Ryan Fire (Routt County), Silver Creek Fire (Grand County), Cache Creek Fire (Garfield County), Boone Draw and Three Wash Fires (Moffat County).

With ongoing dry conditions, not too much to see on the State Precipitation Map below.

Click Here For Map Overview

The map below shows radar-estimated, rainfall gage-adjusted Quantitative Precipitation Estimates (QPE) across Colorado. The map is updated daily during the operational season (May 1 – Sep 30) by 11AM. The following six layers are currently available: 24-hour, 48-hour and 72-hour total precipitation, as well as maximum 1-hour, 2-hour and 6-hour precipitation over the past 24 hour period (to estimate where flash flooding may have occurred). The 24-hour, 48-hour and 72-hour total precipitation contain bias corrections that are not disaggregated into the hourly estimates, so there will likely be some differences. The accumulation ending time is 7AM of the date shown in the bottom right corner. Also shown optionally are fire burn areas (post 2012), which are updated throughout the season to include new burn areas. The home button in the top left corner resets the map to the original zoom.