Issue Date: Sunday, May 5th, 2019
Issue Time: 9:10 AM MDT
Summary:
Temperatures continued their upward trend yesterday, with highs a few degrees above those of Friday. The day started with plentiful sunshine before high-based clouds developed during the late morning/early afternoon over/near the higher terrain as a ribbon of moisture traversed the region. This cloud cover mainly provided shade and the sight of virga, as most precipitation evaporated before reaching the ground. Brief periods of light precipitation likely reached the surface at the highest elevations, but nothing of note was observed.
Further east, a surface trough set up across the eastern plains, with easterly surface flow bringing enhanced moisture into far eastern Colorado. This moisture, combined with good instability, led to the development of scattered showers and thunderstorms across the easternmost counties of the state. The strongest storms rumbled over Baca and Prowers counties, producing brief periods of moderate rainfall and 1-inch hail 12 miles NE of Hartman (Prowers County) and 11 miles ESE of Campo (Baca County).
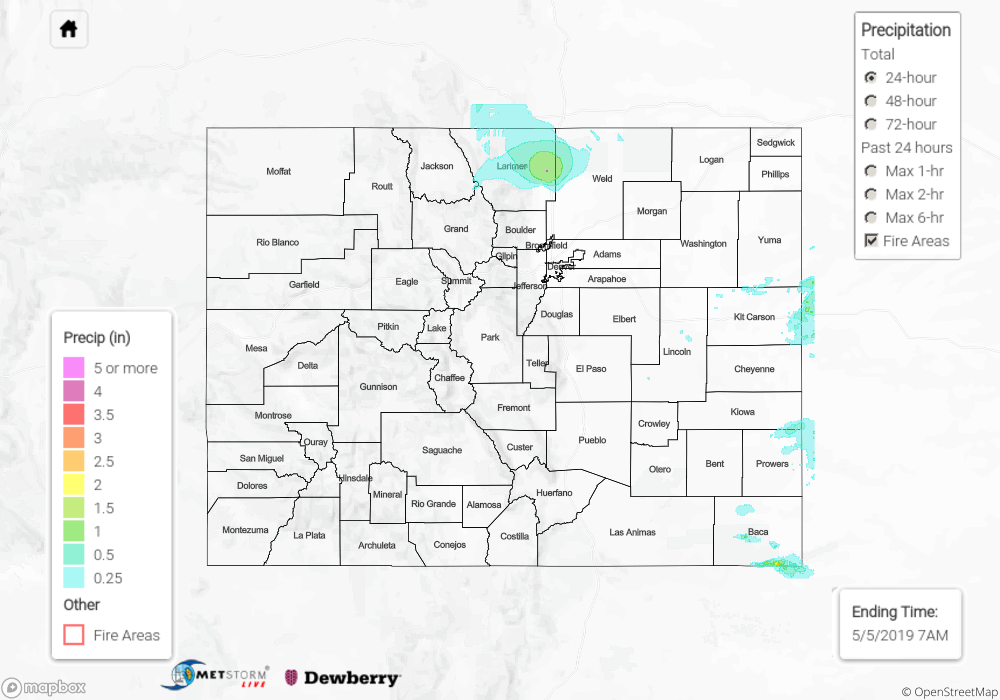
No flash flooding was reported yesterday. For a look at precipitation estimates in your area, please see the State Precipitation Map below. Please note the 5 inches of rain in Larimer County is an error (along with the higher values around it). We are still working to fix this error.
Click Here For Map Overview
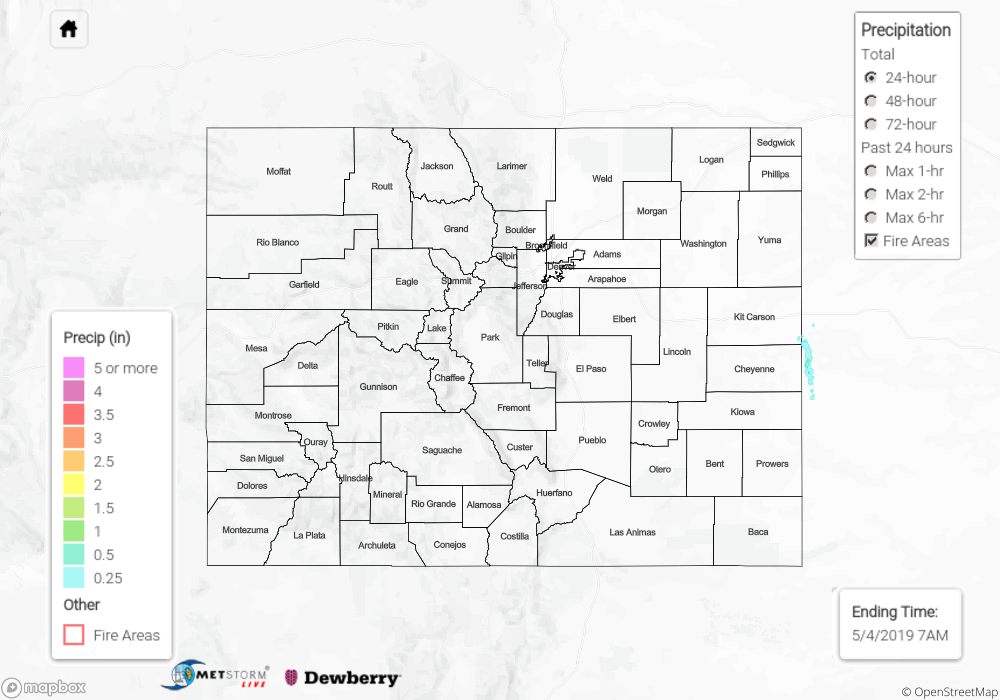
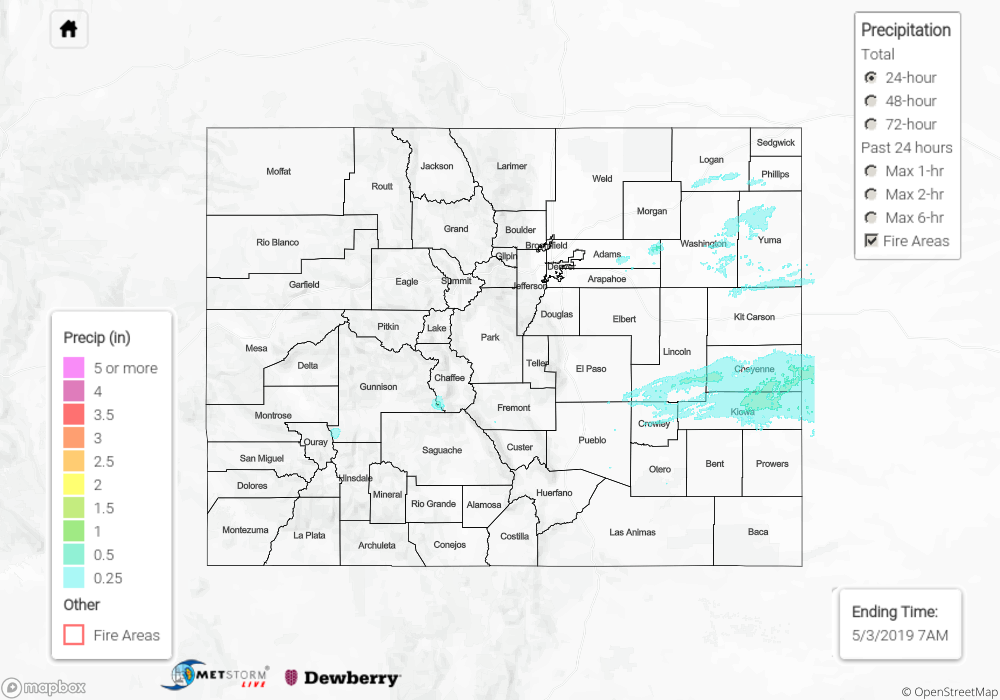
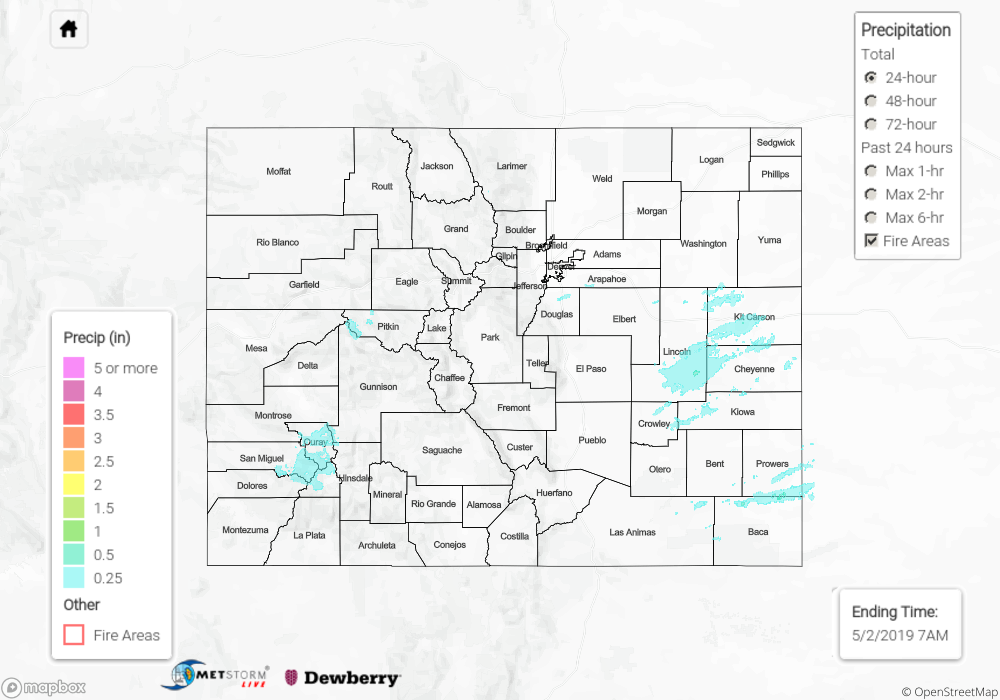
The map below shows radar-estimated, rainfall gage-adjusted Quantitative Precipitation Estimates (QPE) across Colorado. The map is updated daily during the operational season (May 1 – Sep 30) by 11AM. The following six layers are currently available: 24-hour, 48-hour and 72-hour total precipitation, as well as maximum 1-hour, 2-hour and 6-hour precipitation over the past 24 hour period (to estimate where flash flooding may have occurred). The 24-hour, 48-hour and 72-hour total precipitation contain bias corrections that are not disaggregated into the hourly estimates, so there will likely be some differences. The accumulation ending time is 7AM of the date shown in the bottom right corner. Also shown optionally are vulnerable fire burn areas (post 2012), which are updated throughout the season to include new, vulnerable burn areas. The home button in the top left corner resets the map to the original zoom.