Issue Date: Thursday, May 2nd, 2019
Issue Time: 9:00AM MDT
Summary:
A trough moving across the state on Wednesday produced a potpourri of weather. There were showers with snow at higher elevations to start the day over western Colorado. The highest rainfall accumulations were just under 0.2 inches. To the east, cloudiness, fog and light showers were present to start the day. As the shortwave trough moved eastward throughout the day, it helped produced widespread showers east of I-25 and just south of Denver. There was also some decent rainfall accumulation just west of Boulder with totals up to 0.2 inches. Over the southeast corner of the state, where some decent daytime heating was able to occur, a couple high-based, severe thunderstorms were able to form that produced 1 inch diameter hail and totals just over 0.5 inches.
Melting of the snowpack over the San Juan and Central Mountains, rainfall and possibly a little rain on snow has smaller creeks at the lower elevations creeping towards or at bankfull. With warmer temperatures the next couple of days, we will be watching this closely. A Flood Advisory was issued by NWS Pueblo for the Conejos and San Antonio Rivers just east of Antonito when emergency management reported minor flooding. While the flow is expected to remain elevated, major flooding is not expected today.
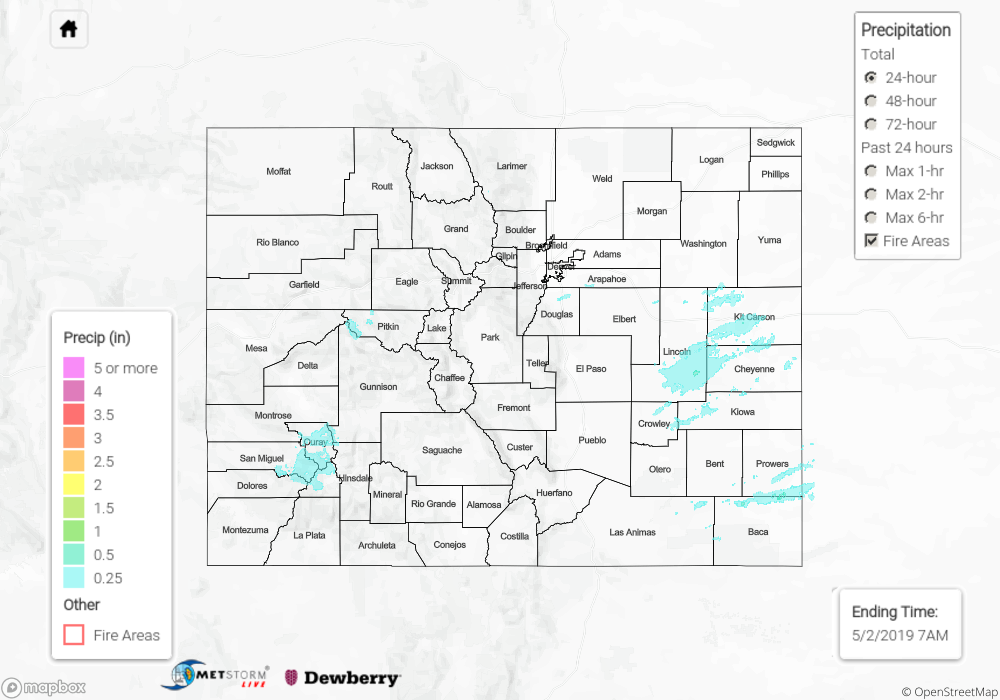
For precipitation estimates over your area on Wednesday, scroll down to the State Precipitation Map below.
Click Here For Map Overview