Issue Date: Friday, May 3rd, 2019
Issue Time: 09:10AM MDT
Summary:
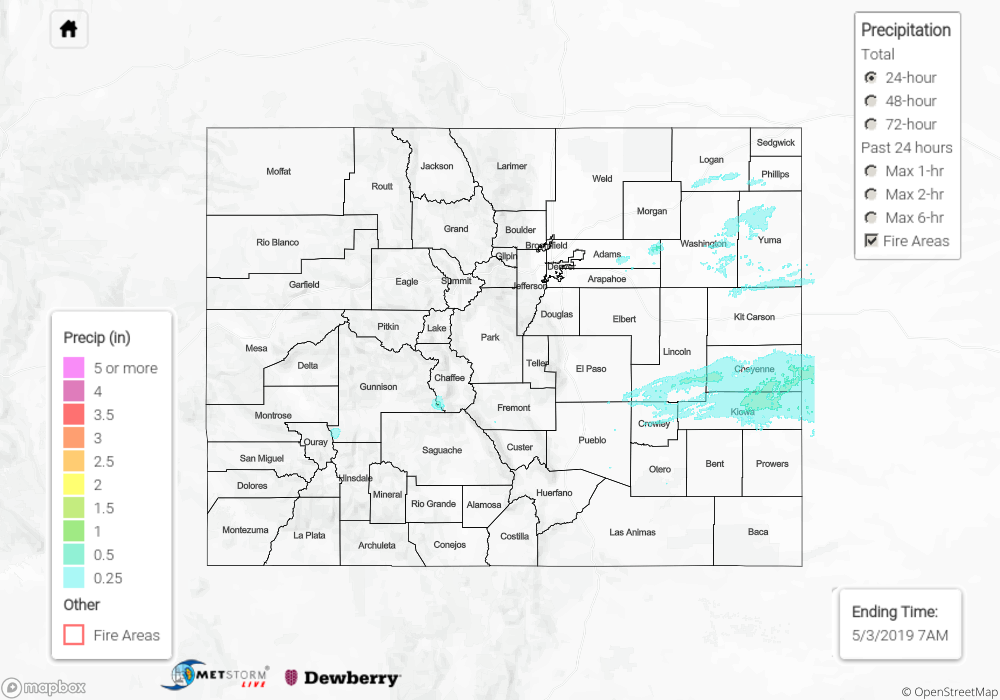
Another day of unsettled weather, however, storms were more scattered in nature when compared to Wednesday. A final vorticity max moved through the state with the passing trough. This initiated some light rainfall and convection over the mountains early on (west), which moved east of the Divide by early afternoon. The far eastern plains had a bit more instability and moisture to work with, so storm intensity picked east of HWY 71. However, a brief, small storm in the Littleton area produced some pea sized hail. A lone Severe Thunderstorm Warning was issued at 8PM for northeastern Crowley County, though there were no storm reports as of 9AM this morning. With high bases, rainfall totals were on the lower end of intensity with radar indicating 0.8 inches falling over Cheyenne and Kiowa Counties. Two CoCoRaHS stations reported just under 0.6 inches for the day out east as well.
Melting of the snowpack over the higher terrains continues. A handful of AHPS stations are creeping towards Action stage, so please stay tuned with the daily FTBs. The Flood Advisory continues for the Conejos and San Antonio Rivers just east of Antonito when emergency management is still reporting minor flooding. Expect this to continue over the next few weeks.
For precipitation totals over in your neighborhood yesterday, scroll down to the State Precipitation Map below.
Click Here For Map Overview