SPM 06-14-2019: Uptick in Thunderstorm Coverage as Trough Approaches from the West

Issue Date: Friday, June 14th, 2019
Issue Time: 10:05AM MDT

Summary:

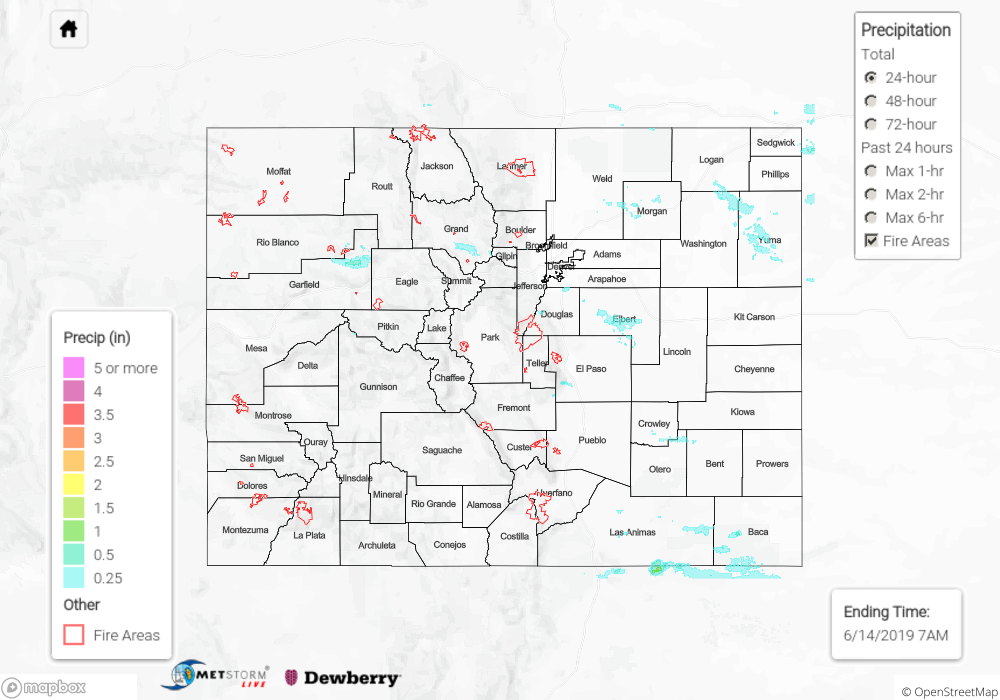
Slight increase in low level moisture under northwesterly/westerly flow yesterday allowed for weak thunderstorms and rainfall to return to the forecast. Mid-level energy also helped increase the coverage of these storms. Rainfall totals from Thursday were greatest over the eastern plains and Palmer Ridge where weak thunderstorms dropped between 0.5 and 0.7 inches of rain. 1.5 inch hail occurred with the storm over Baca County. The largest CoCoRaHS report was near Sterling, which recorded 0.4 inches. Over the mountains, an isolated area in northern Gunnison County recorded 0.5 inches with additional rainfall over northeast Garfield County. Storms over northwest Colorado produced some gusty winds with reports between 50 and 55 mph. The largest gust was recorded at a mesonet in Garfield County, which measured at 69 mph. Flooding was not reported with these storms.
Snowmelt continued across the state with runoff beginning to inch closer to Action and Minor flooding stages. No new flooding reports were available as of this morning, but a new Flood Warning was issued for the Dolores River below Rico. The Flood Watch continues for SW Colorado and the upper Arkansas River through this weekend. Expecting most river flooding to be in lowland areas and banks will have possible erosion issues as well. For the latest, see today’s FTB post.

A nice way to track the rivers is using the AHPS gage network.

Here is a list of the current gages at Action or the Minor flooding stage (as of this morning):

  • Eagle River at Gypsum
  • Surface Creek near Cedaredge
  • East River at Almont
  • Tomichi Creek at Gunnison
  • Mancos River near Mancos
  • La Plata River above Hesperus
  • Navajo River near Chromo
  • Rio Grande near Del Norte – Flood Warning with the gage at Minor flooding
  • Rio Grande at Alamosa
  • Arkansas River at Salida
  • Arkansas River at Wellsville
  • Arkansas River at Parkdale
  • Arkansas River at Canon City
  • Arkansas River at Avondale (elevated due to dam releases from Monday)

To see estimated precipitation totals over your area yesterday, scroll down to the State Precipitation Map below.

Click Here For Map Overview

The map below shows radar-estimated, rainfall gage-adjusted Quantitative Precipitation Estimates (QPE) across Colorado. The map is updated daily during the operational season (May 1 – Sep 30) by 11AM. The following six layers are currently available: 24-hour, 48-hour and 72-hour total precipitation, as well as maximum 1-hour, 2-hour and 6-hour precipitation over the past 24 hour period (to estimate where flash flooding may have occurred). The 24-hour, 48-hour and 72-hour total precipitation contain bias corrections that are not disaggregated into the hourly estimates, so there will likely be some differences. The accumulation ending time is 7AM of the date shown in the bottom right corner. Also shown optionally are vulnerable fire burn areas (post 2012), which are updated throughout the season to include new, vulnerable burn areas. The home button in the top left corner resets the map to the original zoom.

SPM 06-13-2019: Weak Thunderstorms for the Southeast Mountains and High Water over Southwest Colorado

Issue Date: Thursday, June 13th, 2019
Issue Time: 10:00AM MDT

Summary:

Under a drier air mass and thermal ridge, Colorado had another quiet day on the rainfall and thunderstorm front. The best moisture to work with for another round afternoon storms was over southeastern Colorado. Storms kicked off over the southern Front Range and Southeast Mountains with the diurnal flow. With northwest storm motion, they moved into the adjacent plains fairly quickly. Rain rates were greatest over Huerfano County where radar estimated isolated totals up to 0.5 inches. Most storms produced less than 0.1 inches with up to 0.25 inches in their cores.

Once again, the main story was melting and minor flooding along several rivers over the San Juan Mountains and San Luis Valley. No new flooding reports were available as of this morning, but the Flood Warnings and Watches continue for the region along with the upper Arkansas River. Expecting most rivers in these areas to continue to slowly increase through this weekend. For the latest, see today’s FTB post.

A nice way to track the rivers is using the AHPS gage network. Here is a list of the current gages at Action or the Minor flooding stage (as of this morning):

  • Tomichi Creek at Gunnison
  • Mancos River near Mancos
  • La Plata River above Hesperus
  • Animas River above Cedar Hill
  • Navajo River near Chromo
  • Rio Grande near Del Norte – Flood Warning with the gage at Minor flooding
  • Rio Grande at Alamosa
  • Arkansas River at Salida
  • Arkansas River at Wellsville
  • Arkansas River at Parkdale
  • Arkansas River at Canon City
  • Arkansas River at Avondale (elevated due to dam releases from Monday)

To see estimated precipitation totals over your neighborhood on Wednesday, scroll down to the State Precipitation Map below.

Click Here For Map Overview

The map below shows radar-estimated, rainfall gage-adjusted Quantitative Precipitation Estimates (QPE) across Colorado. The map is updated daily during the operational season (May 1 – Sep 30) by 11AM. The following six layers are currently available: 24-hour, 48-hour and 72-hour total precipitation, as well as maximum 1-hour, 2-hour and 6-hour precipitation over the past 24 hour period (to estimate where flash flooding may have occurred). The 24-hour, 48-hour and 72-hour total precipitation contain bias corrections that are not disaggregated into the hourly estimates, so there will likely be some differences. The accumulation ending time is 7AM of the date shown in the bottom right corner. Also shown optionally are vulnerable fire burn areas (post 2012), which are updated throughout the season to include new, vulnerable burn areas. The home button in the top left corner resets the map to the original zoom.

SPM 06-12-2019: Light Rain in the Northeast with Minor Flooding and Rapid Snowmelt in the Southwest

Issue Date: Wednesday, June 12th, 2019
Issue Time: 10:35AM MDT

Summary:

Rainfall returned yesterday to the northeast quadrant of the state on Tuesday as a cold front, aided by the left exit region of the jet stream, provided lift and moisture for the storms.  CoCoRaHS stations reported 0.01-0.09 inches of rain across the Northeast Plains, and northern portions of the Front Range and Urban Corridor.  Precipitation began midday and continued overnight, measuring just under 0.25 inches in Larimer, Washington and Yuma counties. Downward motion and lack of low-level moisture kept the rest of the state dry.  High temperatures decreased slightly in the northern half of the state as a result of cloud cover and the passing cold front from the north.  The southern half of the state saw an increase in high temperatures due to downward motion, clearing skies, and an incoming high pressure system.

Clear skies and high temperatures approaching 80°F over the valleys of the high country allowed for continued snowmelt.  A Flood Warning was issued (and remains in effect) for central Sagauche County and the Rio Grande River near Del Norte.  Areal Flood Advisories were issued for the following: Tomichi Creek at Gunnison, Eagle River at Red Cliff, Central Hinsdale County, Colorado River near CO-UT state line, Los Pinos River near Bayfield, San Juan River at Pagosa Springs, La Plata River at Hesperus, Green River near Jensen, Mancos River near Mancos, Animas River at Durango.

AHPS gages currently at Action or Minor Flooding Stages:

  • Rio Grande near Del Norte (Minor Flooding)
  • Rio Grande at Alamosa
  • Mancos River near Mancos
  • Navajo River near Chromo
  • La Plata River above Hesperus
  • Tomichi Creek at Gunnison
  • Arkansas River at Salida
  • Arkansas River at Wellsville
  • Arkansas River at Canon City
  • Arkansas River at Avondale (dropped below minor flooding overnight)
  • Gunnison River near Grand Junction

Click Here For Map Overview

The map below shows radar-estimated, rainfall gage-adjusted Quantitative Precipitation Estimates (QPE) across Colorado. The map is updated daily during the operational season (May 1 – Sep 30) by 11AM. The following six layers are currently available: 24-hour, 48-hour and 72-hour total precipitation, as well as maximum 1-hour, 2-hour and 6-hour precipitation over the past 24 hour period (to estimate where flash flooding may have occurred). The 24-hour, 48-hour and 72-hour total precipitation contain bias corrections that are not disaggregated into the hourly estimates, so there will likely be some differences. The accumulation ending time is 7AM of the date shown in the bottom right corner. Also shown optionally are vulnerable fire burn areas (post 2012), which are updated throughout the season to include new, vulnerable burn areas. The home button in the top left corner resets the map to the original zoom.

SPM 06-11-2019: Return of Warm Temperatures with Light Precipitation in the Southeast Mountains

Issue Date: Tuesday, June 11th, 2019
Issue Time: 10:30 AM MDT

Summary

Warm temperatures returned across the state yesterday after well below average high temperatures on Sunday. Moisture and cloud cover increased throughout the morning and into the afternoon over southern Colorado, as a high-pressure system centered over southern New Mexico advected warm, moist air from the Gulf of Mexico into the region. Dewpoints in the low 40’s provided moisture for light precipitation over the Southeast Mountains, with measurements primarily between 0.1 and 0.25 inches. CoCoRaHS in the area recorded between 0.15 and 0.3 inches. Isolated, light showers were also radar reported over the southern San Juan Mountains, southern Front Range, and the Urban Corridor between Colorado Springs and Castle Rock. Totals remained low in these areas, with precipitation measurements between 0.01 and 0.1 inches.

Snowmelt continued throughout much of the state yesterday, with maximum temperatures reaching into the 80°F’s over the high country. Overnight lows remained mostly above freezing, inhibiting the snowpack from refreezing overnight. Flood Warnings remain in effect for parts of western Conejos, western Rio Grande, Mineral, and southern Saguache counties. Gauges along the Rio Grande west of Del Norte and in Alamosa remain in Action stage, with waters expected to rise as a result of rain and snowmelt within the area. Minor flooding will be confined to stream banks and low laying areas. Waters within the upper Arkansas River have steadily increased, with Minor flooding and a Flood Warning for issued for Avondale. Areal Flood Advisories have been issued for the following: Los Pinos River near Bayfield, Eagle River at Red Cliff, San Juan River at Pagosa Springs, Green River near Jensen, Duchesne River near Randlett, Gunnison River above Grand Junction, Colorado River near CO-UT state line, Mancos River near Mancos, La Plata River at Hesperus, Animas River at Durango, and Williams Creek upstream from Lower Cristobal. For the latest warnings and advisories, see today’s FTB post as well as NWS Grand Junction and Pueblo.

AHPS gages currently at Action or Minor Flooding Stages:

  • Tomichi Creek at Gunnison
  • Mancos River near Mancos
  • La Plata River above Hesperus
  • Navajo River near Chromo
  • Rio Grande near Del Norte
  • Rio Grande at Alamosa
  • Gunnison River near Grand Junction
  • Colorado River near State Line
  • Arkansas River at Wellsville
  • Arkansas River at Canon City
  • Arkansas River at Pueblo Dam
  • Arkansas River at Avondale (Minor flooding)

To see estimated precipitation totals over your area yesterday, scroll down to the State Precipitation Map below.

Click Here For Map Overview

The map below shows radar-estimated, rainfall gage-adjusted Quantitative Precipitation Estimates (QPE) across Colorado. The map is updated daily during the operational season (May 1 – Sep 30) by 11AM. The following six layers are currently available: 24-hour, 48-hour and 72-hour total precipitation, as well as maximum 1-hour, 2-hour and 6-hour precipitation over the past 24 hour period (to estimate where flash flooding may have occurred). The 24-hour, 48-hour and 72-hour total precipitation contain bias corrections that are not disaggregated into the hourly estimates, so there will likely be some differences. The accumulation ending time is 7AM of the date shown in the bottom right corner. Also shown optionally are vulnerable fire burn areas (post 2012), which are updated throughout the season to include new, vulnerable burn areas. The home button in the top left corner resets the map to the original zoom.