Issue Date: Thursday, June 13th, 2019
Issue Time: 10:00AM MDT
Summary:
Under a drier air mass and thermal ridge, Colorado had another quiet day on the rainfall and thunderstorm front. The best moisture to work with for another round afternoon storms was over southeastern Colorado. Storms kicked off over the southern Front Range and Southeast Mountains with the diurnal flow. With northwest storm motion, they moved into the adjacent plains fairly quickly. Rain rates were greatest over Huerfano County where radar estimated isolated totals up to 0.5 inches. Most storms produced less than 0.1 inches with up to 0.25 inches in their cores.
Once again, the main story was melting and minor flooding along several rivers over the San Juan Mountains and San Luis Valley. No new flooding reports were available as of this morning, but the Flood Warnings and Watches continue for the region along with the upper Arkansas River. Expecting most rivers in these areas to continue to slowly increase through this weekend. For the latest, see today’s FTB post.
A nice way to track the rivers is using the AHPS gage network. Here is a list of the current gages at Action or the Minor flooding stage (as of this morning):
- Tomichi Creek at Gunnison
- Mancos River near Mancos
- La Plata River above Hesperus
- Animas River above Cedar Hill
- Navajo River near Chromo
- Rio Grande near Del Norte – Flood Warning with the gage at Minor flooding
- Rio Grande at Alamosa
- Arkansas River at Salida
- Arkansas River at Wellsville
- Arkansas River at Parkdale
- Arkansas River at Canon City
- Arkansas River at Avondale (elevated due to dam releases from Monday)
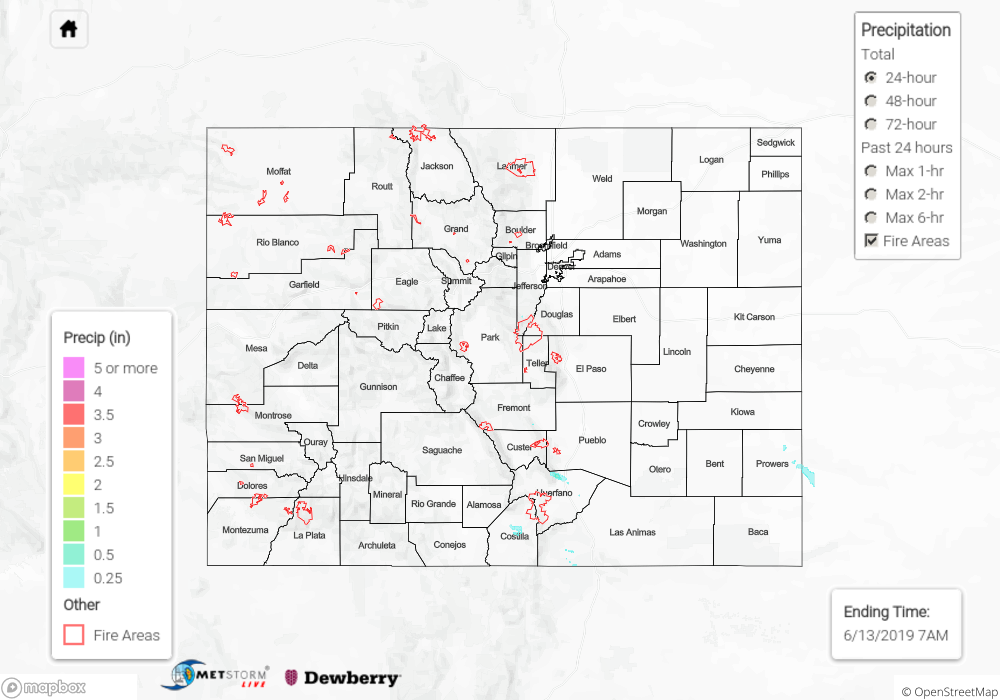
To see estimated precipitation totals over your neighborhood on Wednesday, scroll down to the State Precipitation Map below.
Click Here For Map Overview