Issue Date: Sunday, June 30th, 2019
Issue Time: 9:10 AM MDT
Summary:
The strong upper-level ridge over the central United States kept plenty of sunshine around yesterday, allowing high temperatures to climb back well above average. This intense heating, coupled with mid-level moisture, forced the development of scattered showers and thunderstorms during the afternoon hours and continuing into the evening. Most activity tapered off around sunset, except for an area of showers/thunderstorms near the Cheyenne Ridge. This area of showers/storms lingered until about 11 PM, and then quietly dissipated. Rainfall was hard to come by from any activity, as plenty of dry air below the clouds evaporated much of the precipitation before it could reach the surface. Gusty winds and light rainfall was all the best storms could muster.
Overnight, the next bout of moisture began to arrive from the southwest, which generated nocturnal showers and weak thunderstorms west of the Continental Divide. A few showers continue this morning over the Northwest Slope, Grand Valley, and San Juan Mountains regions. Light rain and gusty winds have been the main impacts with this activity, as well.
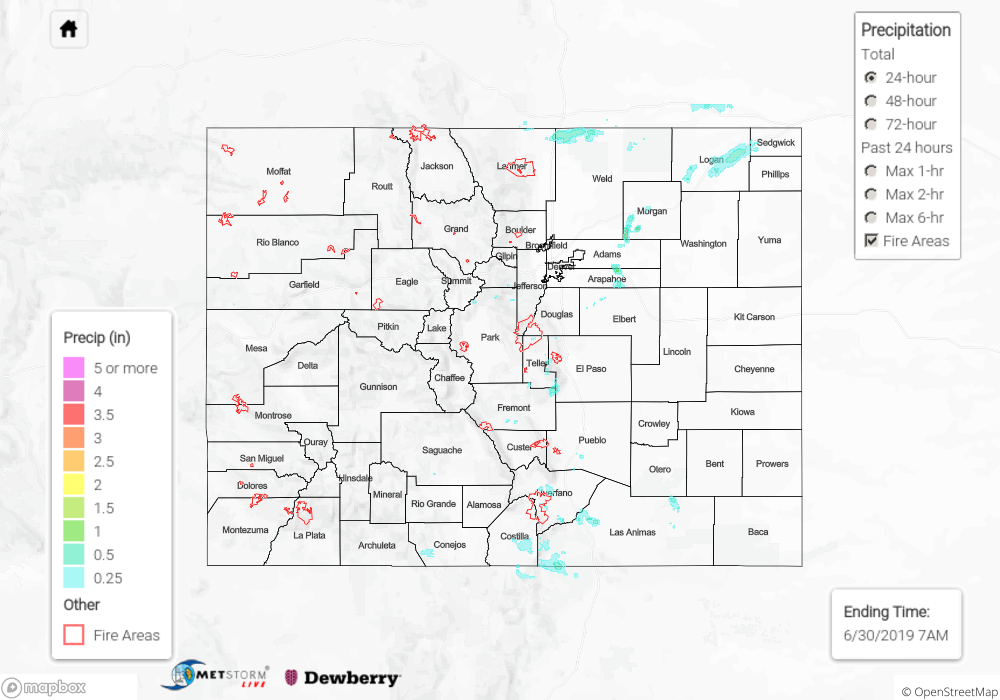
No flash flooding was reported yesterday. For a look at precipitation estimates in your area, please see the State Precipitation Map below.
Click Here For Map Overview
The map below shows radar-estimated, rainfall gage-adjusted Quantitative Precipitation Estimates (QPE) across Colorado. The map is updated daily during the operational season (May 1 – Sep 30) by 11AM. The following six layers are currently available: 24-hour, 48-hour and 72-hour total precipitation, as well as maximum 1-hour, 2-hour and 6-hour precipitation over the past 24 hour period (to estimate where flash flooding may have occurred). The 24-hour, 48-hour and 72-hour total precipitation contain bias corrections that are not disaggregated into the hourly estimates, so there will likely be some differences. The accumulation ending time is 7AM of the date shown in the bottom right corner. Also shown optionally are vulnerable fire burn areas (post 2012), which are updated throughout the season to include new, vulnerable burn areas. The home button in the top left corner resets the map to the original zoom.