Issue Date: Friday, June 28th, 2019
Issue Time: 9:05AM MDT
Summary:
We’ve really jumped right into summer over the last couple of days with the hot temperatures and minimal afternoon rain showers. The 100°F line was reached yesterday in multiple places over the Southeast Plains with Pueblo also recording the century mark. Dry weather and windy conditions over the western border continued the Red Flag Warning. Gusts reached up to 35 mph and sustained winds were in the 10 to 20 mph range. At Douglas Pass in Garfield County, the ASOS recorded a 45 mph wind gust.
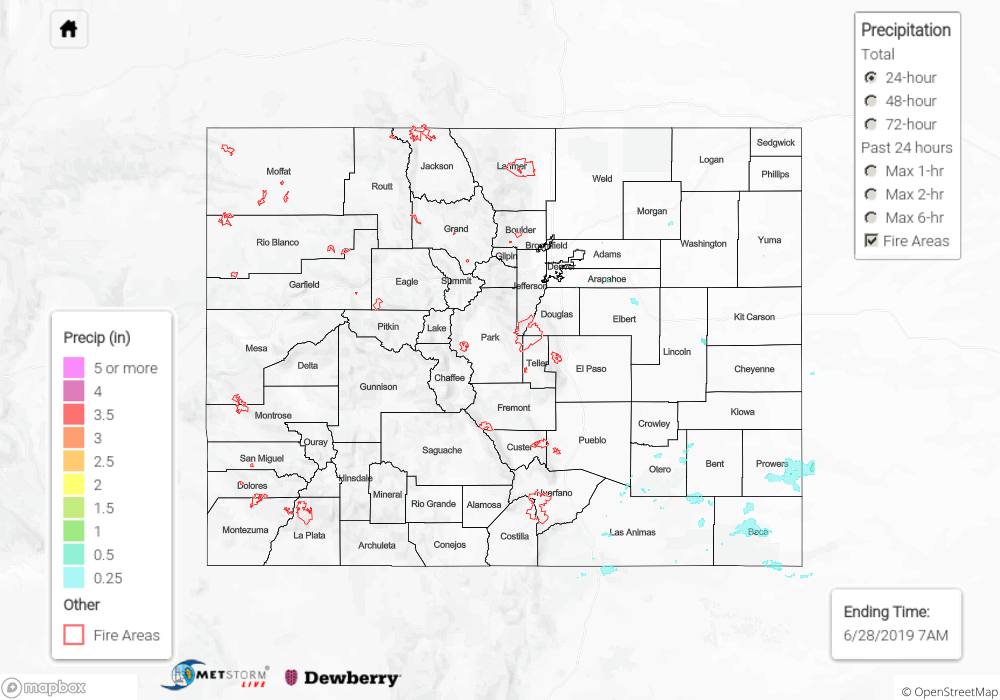
A little bit of moisture was advected into the southern portion of the state associated with a shortwave rotating around the high over New Mexico. This paired with diurnal flow kicked off high-based thunderstorms around noon over the eastern mountains and near the Continental Divide. The bulk of the storm action yesterday afternoon was over the Southeast Mountains and Raton Ridge. The USGS gage in Delhi, CO recorded 0.15 inches. As storms spread east into the Southeast Plains, higher rainfall totals accumulated near the CO/KS border. A CoCoRaHS station in Baca County reported 0.44 inches. Radar estimates rainfall totals just over 0.5 inches fell over this area. This storm also had a Severe Thunderstorm Warning, but there were no storm reports as of this morning. Additional storms kicked off over the southern Front Range and Palmer Ridge intersect around 6:30 PM. Less available low level moisture over the north meant lower rainfall totals. Radar estimates and ground observations were between 0.15 and 0.50 inches over this area. Storm activity ended a couple of hours after sundown as instability decreased.
To see estimated precipitation totals over your neighborhood on Thursday, scroll down to the State Precipitation Map below.
Click Here For Map Overview