Issue Date: Monday, June 1st, 2020
Issue Time: 9:55AM MDT
Summary:
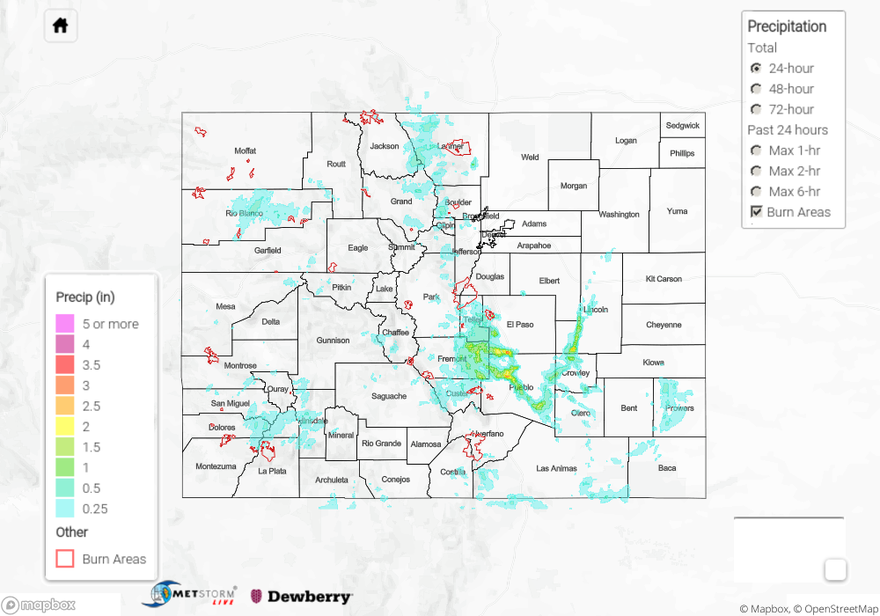
A bit of drying under the ridge with more westerly flow aloft helped decrease the rainfall threat yesterday. With a similar pattern over the last few days, storms were diurnally driven beginning in the early afternoon. Yesterday, storms favored the eastern foothills with lighter rainfall over western Colorado. A strong gust was recorded over Logan County associated with a storm becoming downdraft dominate around 8PM (58 mph). Westerly flow helped push a few of the storms into the adjacent plains, but they mostly only survived over the Palmer and western Raton Ridge (convergence on the higher elevations). Fort Collins got a nice storm with totals on their mesonet up to 0.47 inches. They’ve had about 2 inches of rainfall over the last 30 days. Some stronger storms were also present near the Air Force Academy/Fort Carson areas where USGS gauges recorded just over a half inch of rainfall in 20 minutes.
Back west, the eastern San Juan Mountains got some nice accumulations with the Del Norte area receiving about a half inch of rain. Even the edges of the San Luis Valley received some measurable rainfall, but Alamosa (interior) only received about 0.05 inches. Storms started to come to an end around 11PM, which is a couple hours after instability began to drop off. Flooding was not reported as of this morning.
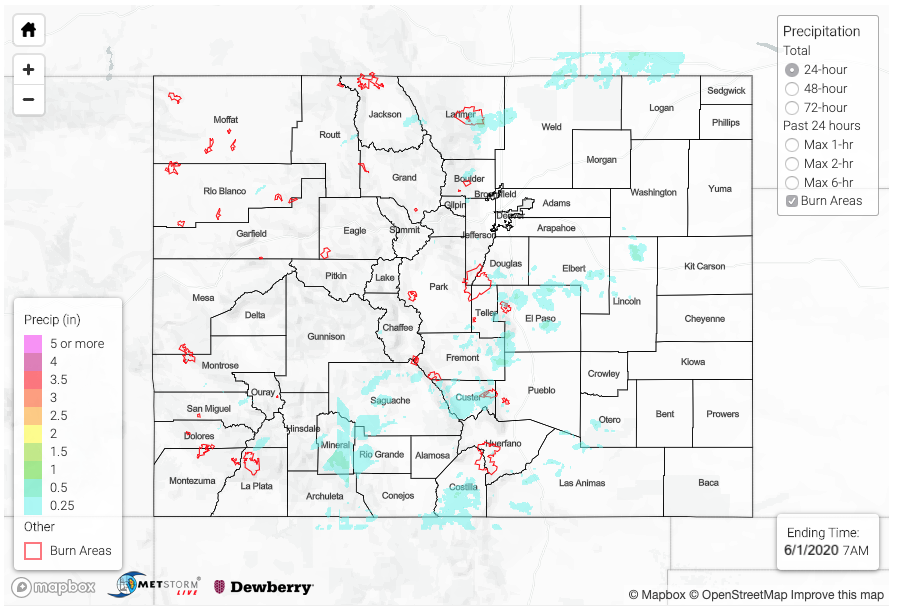
For precipitation estimates in your neighborhood over the last 24-hours, scroll down to the State Precipitation Map below.
Click Here For Map Overview