Issue Date: Saturday, May 30th, 2020
Issue Time: 10:25AM MDT
Summary:
Better moisture was available for the afternoon upslope flow storms that popped yesterday. Storm motion was similar to the previous two days, which meant the big winners were northeast facing slopes over eastern Colorado. Nearly stationary storms/trailing storms helped increase totals over the Southeast Mountains. Max 1-hour rain rates were up to 0.25 inches with 24-hour totals right around 1 inch in Saguache County near the Deckers burn area. A Flash Flood Warning was issued for the Spring Creek burn area at 5:40PM where a spotter recorded 0.56 inches in a 45-minute period. As of this morning, no flooding had been reported.
As storms moved in the adjacent plains, they became sparser in coverage with a nice storm forming over the Greenwood Village area in the afternoon, and an ALERT gage reported 0.67 inches of rainfall near Quincy and Colorado Blvd. Storms also rolled off the Cheyenne Ridge into the Northeast Plains overnight. Totals just over 0.50 inches were estimated by radar.
Over western Colorado, the boundary layer was still dry. This caused some more gusty outflow winds, and the ASOS at the Durango airport recording a 52-mph wind gust. Rainfall was confined to the higher terrains with the highest totals around 0.25 inches.
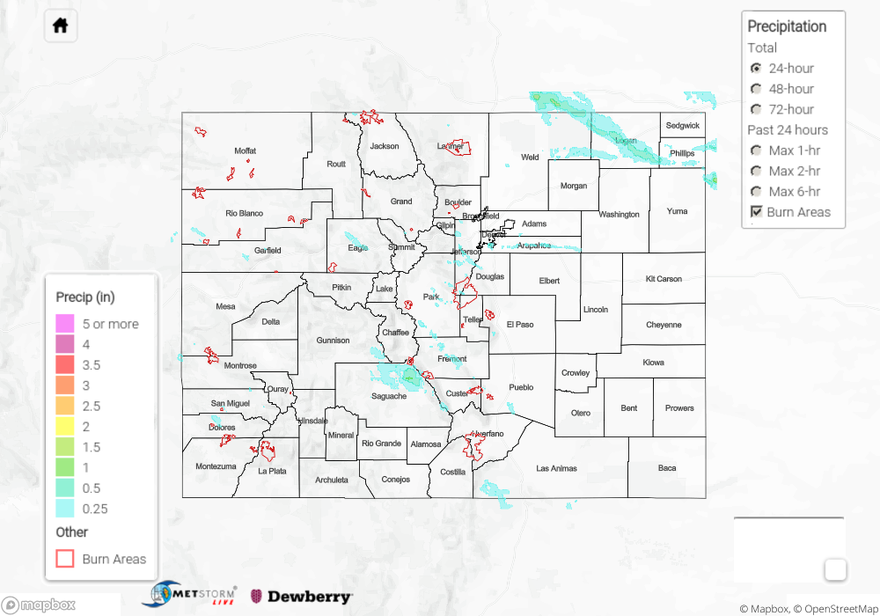
For precipitation estimates in your neighborhood over the last 24-hours, scroll down to the State Precipitation Map below.
Click Here For Map Overview