SPM 06-08-2021: Afternoon Thunderstorms and Landspout Tornado Near Urban Corridor

Issue Date: Tuesday, June 8, 2021
Issue Time: 9:50AM MDT

Summary:

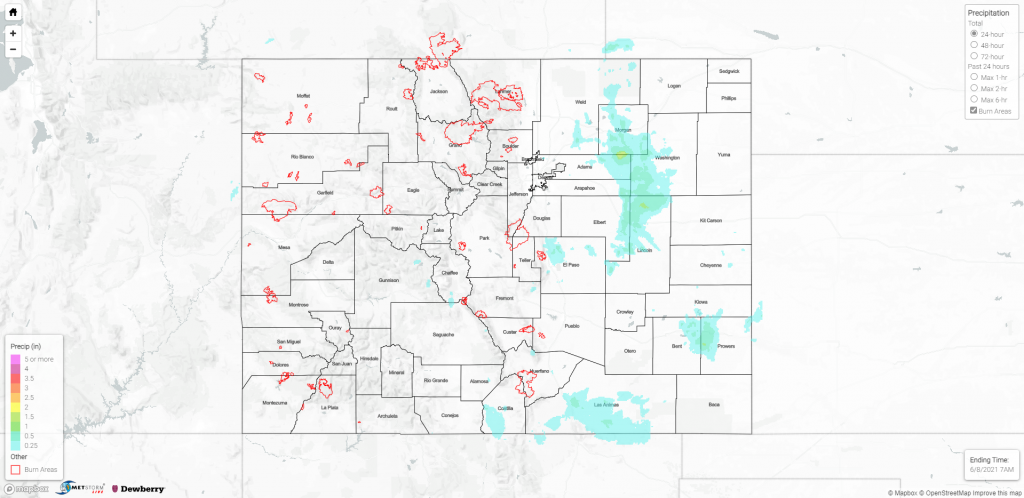
Monday was another day of afternoon thunderstorms, though largely along the Front Range, Urban Corridor and Eastern Plains. As forecasted, rainfall rates with these thunderstorms were generally low and gusty winds and small hail were the bigger threats, though some locations picked up a quick 0.1-0.5 inches under heavy downpours. Elsewhere, a high-pressure ridge in the southwest maintained hot and dry conditions in the western half of the state. Flooding was not reported on Monday. For additional rainfall totals in your area, check out the State Precipitation Map at the bottom of today’s post.

Notably, one of the storms along the Urban Corridor produced a highly-observed landspout tornado near Platteville, CO yesterday (as a consequence of being near major urban areas, there are more people to see it). A landspout is a “subset of tornadoes that occur independent of parent mesocyclone” as defined by the American Meteorological Society. More simply, a landspout occurs when the rotation comes from the boundary layer, rather than cyclonic rotation within a convective storm. Social media was full of great pictures and videos of the event, including this compilation video from Mile High Wx.

Click Here For Map Overview

The map below shows radar-estimated, rainfall gage-adjusted Quantitative Precipitation Estimates (QPE) across Colorado. The map is updated daily during the operational season (May 1 – Sep 30) by 11AM. The following six layers are currently available: 24-hour, 48-hour and 72-hour total precipitation, as well as maximum 1-hour, 2-hour and 6-hour precipitation over the past 24 hour period (to estimate where flash flooding may have occurred). The 24-hour, 48-hour and 72-hour total precipitation contain bias corrections that are not disaggregated into the hourly estimates, so there will likely be some differences. The accumulation ending time is 7AM of the date shown in the bottom right corner. Also shown optionally are vulnerable fire burn areas (post 2012), which are updated throughout the season to include new, vulnerable burn areas. The home button in the top left corner resets the map to the original zoom.

SPM 06-07-2021: Late Night Flash Flood in Lamar, CO

Issue Date: Monday, June 7, 2021
Issue Time: 9:45AM MDT

Summary:

Sunday, June 6 was a very typical summer set up, as mentioned in the flood threat bulletin yesterday. The first round of initial high elevation thunderstorms began to pop up in the late morning and early afternoon. Localized heavy rainfall resulted in another flood advisory issued for a portion of the Cameron Peak burn scar as Doppler radar indicated heavy rain, though no flood reports were made.

Storms continued into the afternoon and evening moving eastward out of the high elevations onto the eastern plains. As storms moved eastward, the potential for severe thunderstorms increased. Several severe storm warnings were issued, with wind gusts and large hail as the main threats, but still potential for localized heavy rainfall. For rainfall estimates in your area, check out the State Precipitation Map at the bottom of this post.

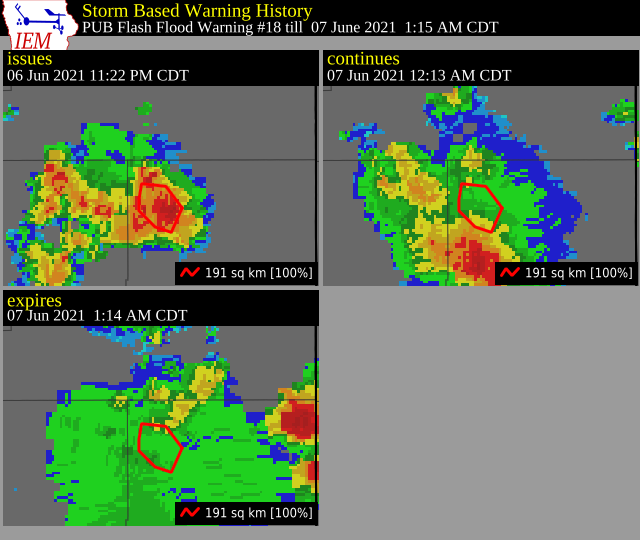
Flash flooding was observed last night by a trained spotter in Lamar (Northwestern Prowers County) in southeast Colorado. At 10:22 pm, a flash flood warning was issued and remained in effect until shortly after midnight. The text of the warning and updates tells the story of observed flooding from the onset of heavy rain to flood waters receding, and the associated radar reflectively maps below also align with the issuance and update to get the full picture (note, the radar reflectivity map times are in Central time).

Flash flood warning issued by PUB at 10:22 pm (6/6)

According to NOAA Atlas 14, a rainfall rate of 1 inch/hour in Lamar is between a 1-year and 2-year average recurrence interval, however a rainfall rate of up to 3 inches/hour is between a 100-year and 200-year average recurrence interval!

Flash flood warning updated by PUB at 11:13 pm (6/6)

Flash flood warning expired at 12:15 am (6/7)


Click Here For Map Overview

The map below shows radar-estimated, rainfall gage-adjusted Quantitative Precipitation Estimates (QPE) across Colorado. The map is updated daily during the operational season (May 1 – Sep 30) by 11AM. The following six layers are currently available: 24-hour, 48-hour and 72-hour total precipitation, as well as maximum 1-hour, 2-hour and 6-hour precipitation over the past 24 hour period (to estimate where flash flooding may have occurred). The 24-hour, 48-hour and 72-hour total precipitation contain bias corrections that are not disaggregated into the hourly estimates, so there will likely be some differences. The accumulation ending time is 7AM of the date shown in the bottom right corner. Also shown optionally are vulnerable fire burn areas (post 2012), which are updated throughout the season to include new, vulnerable burn areas. The home button in the top left corner resets the map to the original zoom.

SPM 06-06-2021: High Elevation Thunderstorms

Issue Date: Sunday, June 6, 2021
Issue Time: 9:20AM MDT

Summary:

Thunderstorms began to develop in the late morning at high elevations as moisture was funneled in Western Colorado around a high-pressure system situated southwest of the state. Widespread thunderstorm activity increased in the afternoon bringing light, but much needed, precipitation to the west, including 0.11” in East Grand Junction, and similar 0.10-0.15 inch totals in the Southwest Slope and San Juan Mountains according to CoCoRaHS observers. For additional rainfall estimates in your area, check out the State Precipitation Map at the bottom of this post.

Several flood advisories or warnings were issued across the state over major burn areas, including flood advisories for the East Troublesome and Williams Fork burn areas, and flash flood warnings for the Cameron Peak and Spring Creek burn areas. These warnings were issued after Doppler radar indicated heavy rain due to thunderstorms. However, no additional flood reports were made at these locations (or elsewhere in Colorado). For the burn areas, a lack of reports could simply be due to their remote locations, which limit human observations of flooding.

As the day progressed to the evening, some storms began to spill over from the Front Range and into the Urban Corridor. A severe thunderstorm warning was issued for Castle Rock and the surrounding areas after radar indicated quarter-sized hail. Again, precipitation totals with these storms were light, but they did put on quite a lightning show, as seen in many social media posts, including the following taken in Centennial.

Click Here For Map Overview

The map below shows radar-estimated, rainfall gage-adjusted Quantitative Precipitation Estimates (QPE) across Colorado. The map is updated daily during the operational season (May 1 – Sep 30) by 11AM. The following six layers are currently available: 24-hour, 48-hour and 72-hour total precipitation, as well as maximum 1-hour, 2-hour and 6-hour precipitation over the past 24 hour period (to estimate where flash flooding may have occurred). The 24-hour, 48-hour and 72-hour total precipitation contain bias corrections that are not disaggregated into the hourly estimates, so there will likely be some differences. The accumulation ending time is 7AM of the date shown in the bottom right corner. Also shown optionally are vulnerable fire burn areas (post 2012), which are updated throughout the season to include new, vulnerable burn areas. The home button in the top left corner resets the map to the original zoom.

SPM 06-05-2021: Severe Thunderstorms in San Luis Valley

Issue Date: Saturday, June 5, 2021
Issue Time: 9:20AM MDT

Summary:

Yesterday was another especially toasty day across the state, with highs in the 90s along the Westerns Slope and reaching into the upper 80s along the Front Range and Eastern Plains. There was little relief in terms of moisture as the scattered thunderstorms that did form in the southwest were short-lived in nature, producing small hail and only light precipitation totals. The main threat from these storms was gusty outflow winds, and a 55 mph thunderstorm wind gust was recorded at Montrose Regional Airport.

Further east, two severe thunderstorm warnings were issued in the San Juan Luis Valley yesterday evening after radar indicated 60 mph wind gusts and up to quarter size hail. Light precipitation was observed with these storms, though totals vary from only a Trace to approximately 0.20” inches in Alamosa and Saguache counties. Remarks from CoCoRaHS observers echo the short-lived nature of the precipitation.

As anticipated, flooding was not reported on Friday. For additional rainfall estimates in your area, check out the State Precipitation Map below.

Click Here For Map Overview

The map below shows radar-estimated, rainfall gage-adjusted Quantitative Precipitation Estimates (QPE) across Colorado. The map is updated daily during the operational season (May 1 – Sep 30) by 11AM. The following six layers are currently available: 24-hour, 48-hour and 72-hour total precipitation, as well as maximum 1-hour, 2-hour and 6-hour precipitation over the past 24 hour period (to estimate where flash flooding may have occurred). The 24-hour, 48-hour and 72-hour total precipitation contain bias corrections that are not disaggregated into the hourly estimates, so there will likely be some differences. The accumulation ending time is 7AM of the date shown in the bottom right corner. Also shown optionally are vulnerable fire burn areas (post 2012), which are updated throughout the season to include new, vulnerable burn areas. The home button in the top left corner resets the map to the original zoom.