Issue Date: Monday, June 7, 2021
Issue Time: 9:45AM MDT
Summary:
Sunday, June 6 was a very typical summer set up, as mentioned in the flood threat bulletin yesterday. The first round of initial high elevation thunderstorms began to pop up in the late morning and early afternoon. Localized heavy rainfall resulted in another flood advisory issued for a portion of the Cameron Peak burn scar as Doppler radar indicated heavy rain, though no flood reports were made.
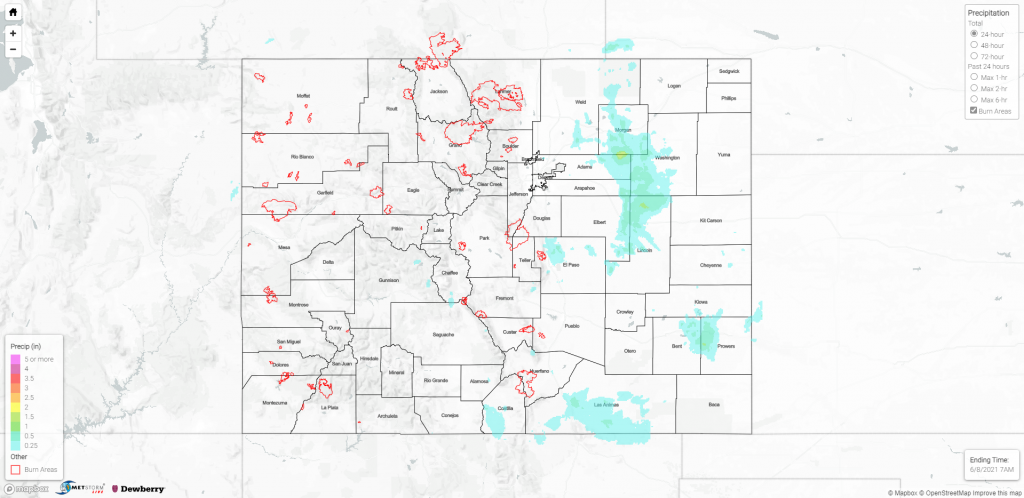
Storms continued into the afternoon and evening moving eastward out of the high elevations onto the eastern plains. As storms moved eastward, the potential for severe thunderstorms increased. Several severe storm warnings were issued, with wind gusts and large hail as the main threats, but still potential for localized heavy rainfall. For rainfall estimates in your area, check out the State Precipitation Map at the bottom of this post.
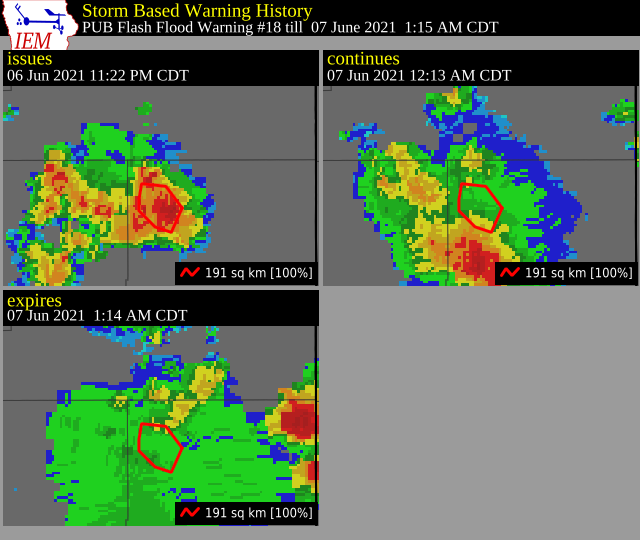
Flash flooding was observed last night by a trained spotter in Lamar (Northwestern Prowers County) in southeast Colorado. At 10:22 pm, a flash flood warning was issued and remained in effect until shortly after midnight. The text of the warning and updates tells the story of observed flooding from the onset of heavy rain to flood waters receding, and the associated radar reflectively maps below also align with the issuance and update to get the full picture (note, the radar reflectivity map times are in Central time).
Flash flood warning issued by PUB at 10:22 pm (6/6)
According to NOAA Atlas 14, a rainfall rate of 1 inch/hour in Lamar is between a 1-year and 2-year average recurrence interval, however a rainfall rate of up to 3 inches/hour is between a 100-year and 200-year average recurrence interval!
Flash flood warning updated by PUB at 11:13 pm (6/6)
Flash flood warning expired at 12:15 am (6/7)
Click Here For Map Overview

