SPM 06-16-2021: Record Breaking Heat Across Colorado

Issue Date: Wednesday, June 16, 2021
Issue Time: 9:30 AM MDT

Summary:

Yesterday saw afternoon thunderstorm development in the Southeast Mountains, Raton Ridge, Palmer Ridge, and Eastern Plains. Severe thunderstorm warnings were issued west of Limon, with the main threat being high winds and large, damaging hail. A flash flood warning was also issued for the Spring burn scar after Doppler radar indicated heavy rain in the area. Neither warnings materialized to severe weather or flood reports. Precipitation totals were lighter, with rainfall between 0.01-0.15 inches from CoCoRaHS observers and NWS COOP stations, which may not be reflected in the SPM. For rainfall estimates in your area, including antecedent conditions, check out the State Precipitation Map at the bottom of today’s post.

The real headline of yesterday was the scorcher of a day across the state, with new record high temperatures set from Grand Junction to Fort Collins. High temperatures mixed with wildfire smoke contributed to poor air quality across the state as well.

Click Here For Map Overview

The map below shows radar-estimated, rainfall gage-adjusted Quantitative Precipitation Estimates (QPE) across Colorado. The map is updated daily during the operational season (May 1 – Sep 30) by 11AM. The following six layers are currently available: 24-hour, 48-hour and 72-hour total precipitation, as well as maximum 1-hour, 2-hour and 6-hour precipitation over the past 24 hour period (to estimate where flash flooding may have occurred). The 24-hour, 48-hour and 72-hour total precipitation contain bias corrections that are not disaggregated into the hourly estimates, so there will likely be some differences. The accumulation ending time is 7AM of the date shown in the bottom right corner. Also shown optionally are vulnerable fire burn areas (post 2012), which are updated throughout the season to include new, vulnerable burn areas. The home button in the top left corner resets the map to the original zoom.

SPM 06-15-2021: Hot and Dry Across State

Issue Date: Tuesday, June 15, 2021
Issue Time: 9:00 AM MDT

Summary:

Monday can really only be described as hot and dry across the entire state of Colorado. Many stations got up to the high 90s along the Urban Corridor and Eastern Plains, including over 100 in La Junta. Low 100s were reported up and down the Western Slope and Grand Valley, including 104 in Delta. Highs were in the 80s and even 90s in the high elevations, with 91 as the observed high in Aspen. In addition to the heat, air quality, especially in the Urban Corridor, has been poor since high temperatures drive increased ozone pollution. Visible smoke was also in the air from fires elsewhere in the southwest.

There was some isolated convection in the evening yesterday, but hardly any measurable precipitation and no warnings were issued from or reports made to the NWS. Flooding was not reported on Monday. For rainfall estimates in your area, check out the State Precipitation Map below.

Click Here For Map Overview

The map below shows radar-estimated, rainfall gage-adjusted Quantitative Precipitation Estimates (QPE) across Colorado. The map is updated daily during the operational season (May 1 – Sep 30) by 11AM. The following six layers are currently available: 24-hour, 48-hour and 72-hour total precipitation, as well as maximum 1-hour, 2-hour and 6-hour precipitation over the past 24 hour period (to estimate where flash flooding may have occurred). The 24-hour, 48-hour and 72-hour total precipitation contain bias corrections that are not disaggregated into the hourly estimates, so there will likely be some differences. The accumulation ending time is 7AM of the date shown in the bottom right corner. Also shown optionally are vulnerable fire burn areas (post 2012), which are updated throughout the season to include new, vulnerable burn areas. The home button in the top left corner resets the map to the original zoom.

SPM 06-14-2021: Thunderstorms Along Urban Corridor

Issue Date: Monday, June 14, 2021
Issue Time: 9:15 AM MDT

Summary:

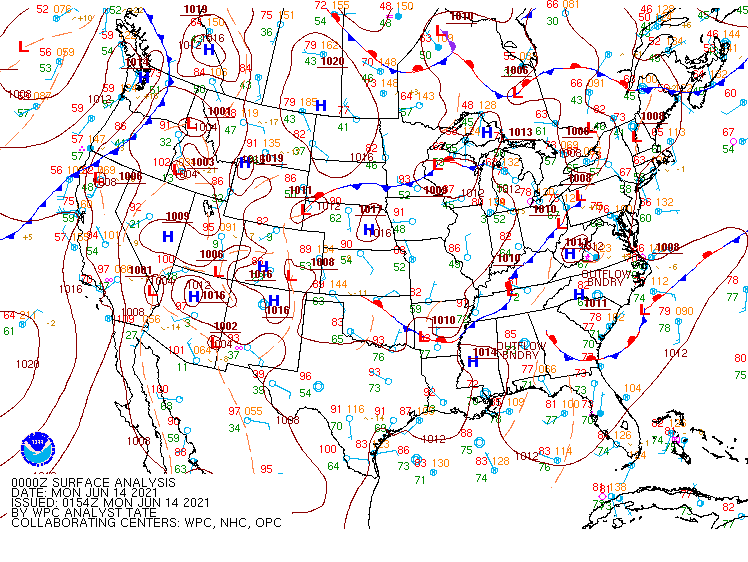
Thunderstorms began to fire up and down the Urban Corridor in the early evening yesterday thanks to a surface low located in the southeast corner of the state, and a persistent north-south trough. Both features can be seen in the WPC surface analysis valid for 6:00 pm yesterday (00Z) below.

A series of severe thunderstorm warnings were issued yesterday from the Colorado-Wyoming border to Colorado Springs associated with these storms, with the greatest threat being large hail. Clusters of damaging hail reports were made around Greeley, Southeast Denver, and Woodland Park areas, with the largest observation being 1.75 inch hail reported in Aurora. Heavy rain was not as large of a threat, however some isolated cells still saw rainfall rates of up to 1 inch/hour, according to the MetStorm Live grids in the State Precipitation Map.

Elsewhere, hot and dry conditions continued for the mountains and western slope, where fire danger remains critically high. Flooding was not reported on Sunday. For rainfall estimates in your area, check out the State Precipitation Map below.

Click Here For Map Overview

The map below shows radar-estimated, rainfall gage-adjusted Quantitative Precipitation Estimates (QPE) across Colorado. The map is updated daily during the operational season (May 1 – Sep 30) by 11AM. The following six layers are currently available: 24-hour, 48-hour and 72-hour total precipitation, as well as maximum 1-hour, 2-hour and 6-hour precipitation over the past 24 hour period (to estimate where flash flooding may have occurred). The 24-hour, 48-hour and 72-hour total precipitation contain bias corrections that are not disaggregated into the hourly estimates, so there will likely be some differences. The accumulation ending time is 7AM of the date shown in the bottom right corner. Also shown optionally are vulnerable fire burn areas (post 2012), which are updated throughout the season to include new, vulnerable burn areas. The home button in the top left corner resets the map to the original zoom.

SPM 06-13-2021: Evening Thunderstorms in Southeast Plains

Issue Date: Sunday, June 13, 2021
Issue Time: 10:00 AM MDT

Summary:

Friday’s cool down was short-lived, as temperatures on Saturday rose back into the upper 80’s and 90’s for most of the state, with highs in the upper 70’s for the high elevations. As indicated in the flood threat bulletin yesterday, the best chance for some storms was in the far Southeast Plains and Raton Ridge. A series of severe thunderstorm warnings were issued for issued for a storm complex in Las Animas and Baca counites, after radar indicated large hail, high winds, and a potential tornado. No severe reports were made in Colorado, but this system did move on to produce large hail and high winds in the Oklahoma Panhandle and Texas. While still in Colorado, the storms left a swatch of 0.25-1.0 inch precipitation across Las Animas and Baca counties, and small (pea-size) hail according to a CoCoRaHS obsever in Pritchett (Las Animas county). For rainfall estimates in your area, check out the State Precipitation Map below. No flooding was reported on Saturday.

Click Here For Map Overview

The map below shows radar-estimated, rainfall gage-adjusted Quantitative Precipitation Estimates (QPE) across Colorado. The map is updated daily during the operational season (May 1 – Sep 30) by 11AM. The following six layers are currently available: 24-hour, 48-hour and 72-hour total precipitation, as well as maximum 1-hour, 2-hour and 6-hour precipitation over the past 24 hour period (to estimate where flash flooding may have occurred). The 24-hour, 48-hour and 72-hour total precipitation contain bias corrections that are not disaggregated into the hourly estimates, so there will likely be some differences. The accumulation ending time is 7AM of the date shown in the bottom right corner. Also shown optionally are vulnerable fire burn areas (post 2012), which are updated throughout the season to include new, vulnerable burn areas. The home button in the top left corner resets the map to the original zoom.