SPM 09-01-2017: Numerous Showers And Storms Across High Country And Foothills

Issue Date: Friday, September 1, 2017
Issue Time: 10:40AM MDT

Summary:

An incoming disturbance provided enough upward motion that combined with a bit of atmospheric instability to create numerous to widespread showers and storms across the higher elevations. This sounds more ominous than it was given most storms only lasted for a 15-30 minute period. Showers were the common precipitation form west of the Continental Divide with a few tenths of rainfall reported, while thunderstorms were added in the mix to the east. Storms moved at a rapid pace, preventing much rainfall at a given locale. However, a few storms grew big enough to produce short-term heavy rainfall. The highest observed rainfall amounts were across the Front Range and Palmer Divide with up to 0.8 inches being reported. However, radar based estimates suggest up to 2 inches fell in localized parts of Morgan, Adams and Fremont counties though unfortunately it was difficult to confirm this without ground based measurements. A cluster of storms prompted a brief Flash Flood Warning for the East Peak fire scar, where up to 1 inch of rainfall may have fallen.

In addition to the rainfall, gusty winds were reported across many higher elevation locations. For example, gusts up to 57 and 51 mph were reported in Rio Blanco and Eagle counties, respectively.

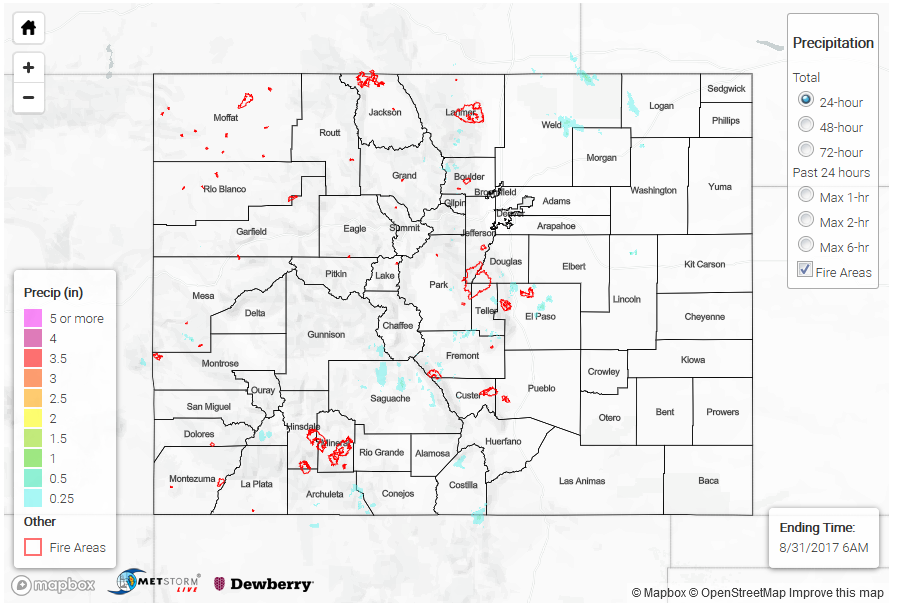
Flooding was not reported on Thursday. For rainfall estimates in your area, check out our State Precipitation Map below.

Click Here For Map Overview

The map below shows radar-estimated, rainfall gage-adjusted Quantitative Precipitation Estimates (QPE) across Colorado. The map is updated daily during the operational season (May 1 – Sep 30) by 11AM. The following six layers are currently available: 24-hour, 48-hour and 72-hour total precipitation, as well as maximum 1-hour, 2-hour and 6-hour precipitation over the past 24 hour period (to estimate where flash flooding may have occurred). The accumulation ending time is 6AM of the date shown in the bottom right corner. Also shown optionally are fire burn areas since 2012. The home button in the top left corner resets the map to the original zoom.

Note: We have identified a possible underestimation in QPE over the southwest part of the state. We are working to on this issue, and will provide an update as soon as possible.

SPM 08-31-2017: Scattered Storms Mainly Across High Country And Nearby Foothills

Issue Date: Thursday, August 31, 2017
Issue Time: 9:50AM MDT

Summary:

Afternoon and evening shower and storm activity was once again mainly limited to the High Country and nearby foothills where instability was greatest. With marginal moisture available for thunderstorms, rain rates were again limited, though a few storms produced short-term heavy rainfall. CoCoRaHS observers in Larimer, Fremont and Arapahoe counties noted just over 0.75 inches of rainfall, occurring in about an hour or less. Radar supplemented estimates suggest up to 1.5 inches over Morgan County, and up to 1 inch in Custer County. A cluster of storms moved across the Hayden Pass burn scar in the late afternoon, prompting a Flash Flood Warning. Western and eastern portions of the burn scar were estimated to have received 0.25 to 0.5 inches of rain. Fortunately, flooding was not reported.

A local storm report of gusty winds was received in Gunnison County, likely associated with a thunderstorm’s rain cooled downdraft.

The increased cloud cover caused a slightly downtick in afternoon high temperatures, though readings up to 10F above average were still observed west of the Continental Divide.

Flooding was not reported on Wednesday. For rainfall estimates in your area, check out our State Precipitation Map below.

Click Here For Map Overview

The map below shows radar-estimated, rainfall gage-adjusted Quantitative Precipitation Estimates (QPE) across Colorado. The map is updated daily during the operational season (May 1 – Sep 30) by 11AM. The following six layers are currently available: 24-hour, 48-hour and 72-hour total precipitation, as well as maximum 1-hour, 2-hour and 6-hour precipitation over the past 24 hour period (to estimate where flash flooding may have occurred). The accumulation ending time is 6AM of the date shown in the bottom right corner. Also shown optionally are fire burn areas since 2012. The home button in the top left corner resets the map to the original zoom.

Note: We have identified a possible underestimation in QPE over the southwest part of the state. We are working to on this issue, and will provide an update as soon as possible.

SPM 08-30-2017: Isolated Storms With Short-term Heavy Rainfall; Western Heat Continues

Issue Date: Wednesday, August 30, 2017
Issue Time: 11AM MDT

Summary:

With just enough moisture remaining in the boundary layer, combined with plenty of morning sunshine to heat things up, isolated to widely scattered thunderstorms roamed Colorado’s landscape once again on Tuesday. With mid-level subsidence as a backdrop, storms had a hard time growing in size and lasting much longer than 1 hour. However, lucky locations in the High Country and nearby foothills received a quick 0.25 – 0.5 inches in less than 1 hour. The highest storm coverage was likely over the Palmer Ridge (specifically El Paso County), Weld County as well as the San Juans. The highest CoCoRaHS observation was 0.41 inches in Montezuma County. However, radar-based estimates suggest up to 1 inch may have fallen in remote parts of Weld County. A brief, precautionary Areal Flood Advisory was issued for the Hayden Pass burn scar, however, flooding was not reported as of this morning. The eastern parts of the scar likely received up to 0.25 inches of rain, which could be enough to cause runoff over the sensitive ground depending on how fast the precipitation fell.

Across the Western Slope, heat continued in full force. Grand Junction tied a record high temperature for the date with a reading of 98F as boundary layer moisture mixed out and allowed the sun to efficiently heat the surface. Relative humidity values briefly dropped below 15% across the High Country and lower elevations west of the Continental Divide.

Flooding was not reported on Tuesday. For rainfall estimates in your area, check out our State Precipitation Map below.

Click Here For Map Overview

The map below shows radar-estimated, rainfall gage-adjusted Quantitative Precipitation Estimates (QPE) across Colorado. The map is updated daily during the operational season (May 1 – Sep 30) by 11AM. The following six layers are currently available: 24-hour, 48-hour and 72-hour total precipitation, as well as maximum 1-hour, 2-hour and 6-hour precipitation over the past 24 hour period (to estimate where flash flooding may have occurred). The accumulation ending time is 6AM of the date shown in the bottom right corner. Also shown optionally are fire burn areas since 2012. The home button in the top left corner resets the map to the original zoom.

Note: We have identified a possible underestimation in QPE over the southwest part of the state. We are working to on this issue, and will provide an update as soon as possible.

SPM 08-29-2017: Isolated Storms Continue Out East, While Heat Stays Put West

Issue Date: Tuesday, August 29, 2017
Issue Time: 11AM MDT

Summary:

The Continental Divide continued to be a clear demarcation of weather regimes on Monday. To the west, hot and mainly dry weather was the norm. Grand Junction reached 96F, about 9F above its average high temperature for late August. Even higher elevation locations such as Copper Mountain reached the low 70s F. Isolated showers and storms were observed over the southern San Juans, though only a few tenths of an inch of rainfall, at best, were reported.

To the east of the Divide, higher boundary layer moisture allowed for slightly stronger storms. A cell in Chaffee County produced 0.69 inches (CoCoRaHS) and even prompted a brief Areal Flood Advisory during the late afternoon. Meanwhile, several rounds of rainfall up to 0.5-0.75 inches per hour moved across the far southern Sangre de Cristos. In all, radar estimates suggest up to 1.5 inches occurred. However, flooding was not reported.

For rainfall estimates in your area, check out our State Precipitation Map below.

Click Here For Map Overview

The map below shows radar-estimated, rainfall gage-adjusted Quantitative Precipitation Estimates (QPE) across Colorado. The map is updated daily during the operational season (May 1 – Sep 30) by 11AM. The following six layers are currently available: 24-hour, 48-hour and 72-hour total precipitation, as well as maximum 1-hour, 2-hour and 6-hour precipitation over the past 24 hour period (to estimate where flash flooding may have occurred). The accumulation ending time is 6AM of the date shown in the bottom right corner. Also shown optionally are fire burn areas since 2012. The home button in the top left corner resets the map to the original zoom.

Note: We have identified a possible underestimation in QPE over the southwest part of the state. We are working to on this issue, and will provide an update as soon as possible.