Issue Date: Sunday, June 24th, 2018
Issue Time: 9:30 AM MDT
Summary:
The first round of thunderstorms yesterday developed as daytime heating peaked, producing isolated-to-widely scattered thunderstorms across the northern High Country and portions of the Urban Corridor, Palmer Ridge, and Eastern Plains. Storms over the High Country were garden-variety due to relatively low moisture and instability. Further east over the lower elevations, however, storms had access to good moisture and favorable wind shear, leading to a few becoming strong-to-severe. Brief periods of heavy rain attended these storms, as well, but storm motions mitigated any potential flooding issues.
The second round of storms overlapped a bit with the first round, with isolated-to-scattered showers and storms developing first over the northern and central High Country, then over the lower elevations of eastern Colorado, as an upper-level low tracked into western Wyoming and associated broad-scale lift overspread Colorado. The bulk of this activity occurred along and north of the I-70 corridor, underneath the upper-level support. Storms grew upscale into a thunderstorm complex over the Northeast Plains, eastern Palmer Ridge and northern Southeast Plains, producing strong winds, plenty of lightning, hail, and heavy rainfall. No flash flooding was reported, but there was likely street/field ponding underneath the stronger thunderstorms.
According to CoCoRaHS observers, these are the highest rainfall totals from yesterday:
1.43 inches: Sedgwick County
1.27 inches: Kit Carson County
1.17 inches: Kit Carson County
1.08 inches: Cheyenne County
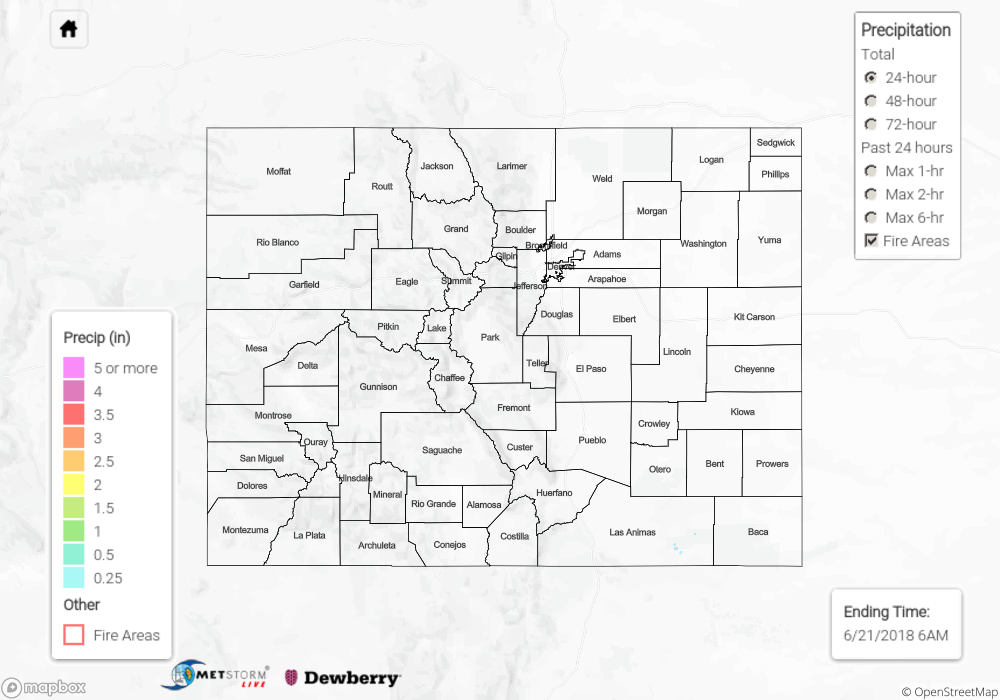
For a look at precipitation estimates in your area, please see our State Precipitation Map below.
Click Here For Map Overview
The map below shows radar-estimated, rainfall gage-adjusted Quantitative Precipitation Estimates (QPE) across Colorado. The map is updated daily during the operational season (May 1 – Sep 30) by 11AM. The following six layers are currently available: 24-hour, 48-hour and 72-hour total precipitation, as well as maximum 1-hour, 2-hour and 6-hour precipitation over the past 24 hour period (to estimate where flash flooding may have occurred). The 24-hour, 48-hour and 72-hour total precipitation contain bias corrections that are not disaggregated into the hourly estimates, so there will likely be some differences. The accumulation ending time is 6AM of the date shown in the bottom right corner. Also shown optionally are fire burn areas (post 2012), which are updated throughout the season to include new burn areas. The home button in the top left corner resets the map to the original zoom.