Issue Date: Friday, June 22, 2018
Issue Time: 09:40AM MDT
Summary:
A mid-level shortwave trough moved through the northern portion of Colorado yesterday afternoon during peak heating. This helped enhance and kick off a little more thunderstorm action over the northern Colorado mountains and Cheyenne Ridge. While, moisture was plentiful at the surface for some rainfall, quick storm motion prevented the isolated thunderstorm, up north, from dropping heavy precipitation over the Urban Corridor. Radar estimates were just over 0.5 inches/hour. Stillwater Creek SNOTEL recorded 0.1 inches of precipitation on Thursday. Another couple isolated thunderstorm fired off the Palmer Ridge and Raton Ridge during the evening hours. Low dew points plus quick storm motion again limited the thunderstorm’s total rainfall. A Mesonet in Sedalia picked up 0.31 inches. After the latest sunset of the year, instability rapidly dropped off and the storms came to an end. There was no flooding on Thursday.
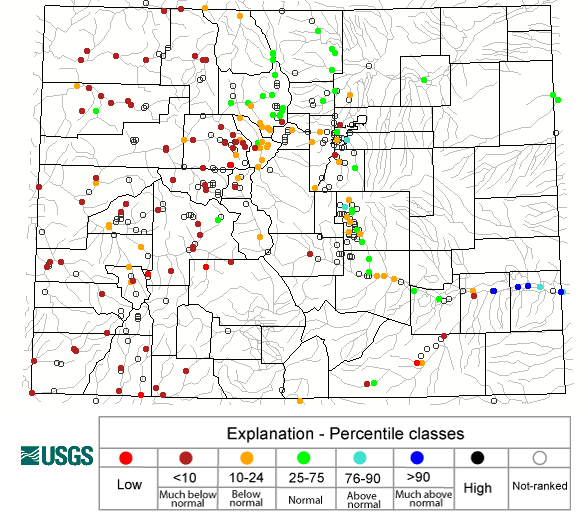
Below is the current streamflow map for the state of Colorado. Streamflow continues to be much below normal for the majority of the high country with the bright red dots representing the lowest recorded streamflow at that location. The reservoir storage maps for June will come out around July 7. The May maps showed reservoir storage was close to or above 100% for all basins. The exception was the San Miguel, Dolores, Animas and San Juan Basin, which was at 75% of average. With the very hot and dry conditions this last month, the June report will likely show decreases in storage across all basins.
To see how much precipitation fell in your area on Thursday, scroll down to the State Precipitation Map below.
Click Here For Map Overview
Note: We have identified a possible underestimation in QPE over the southwest part of the state. We are working to on this issue, and will provide an update as soon as possible.
