Issue Date: Thursday, June 28th, 2018
Issue Time: 9:30 AM MDT
Summary:
The mercury climbed higher over the previous day as the strong high pressure ridge remained overhead. High temperatures were in the upper-90s and low-100s across the eastern plains, with upper-80s in the lower mountain valleys, and upper-90s in the lower valleys near the CO/UT border. A weak ripple in the southwest flow aloft, combined with the strong daytime heating, led to the development of isolated high-based showers/thunderstorms over central and eastern Colorado. Extremely dry air below cloud bases evaporated nearly all rainfall before it could reach the ground, resulting in strong winds gusts and very little rainfall at the surface. In fact, high-based storms near the Denver metro area produced strong wind gusts: a 58 MPH wind gust was reported at Denver International Airport at 4:40 PM, and a 61 MPH wind gust was reported at the NCAR Mesa Lab in Boulder at 6:10 PM. High-based shower/thunderstorm activity diminished from west to east, and the last of the showers ended over the Northeast Plains between 1 and 3 AM.
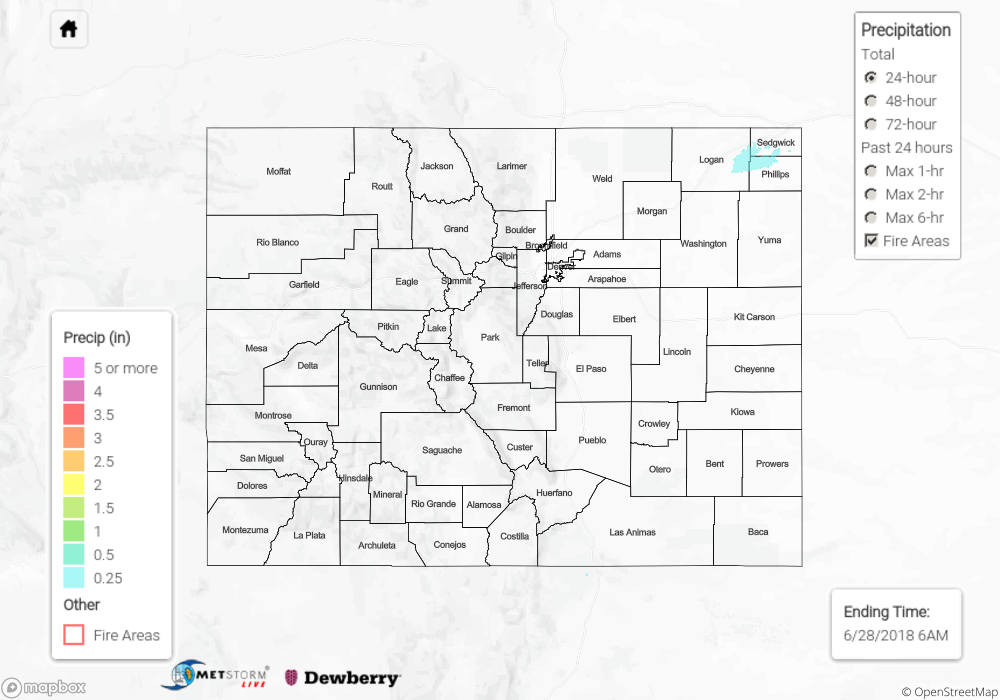
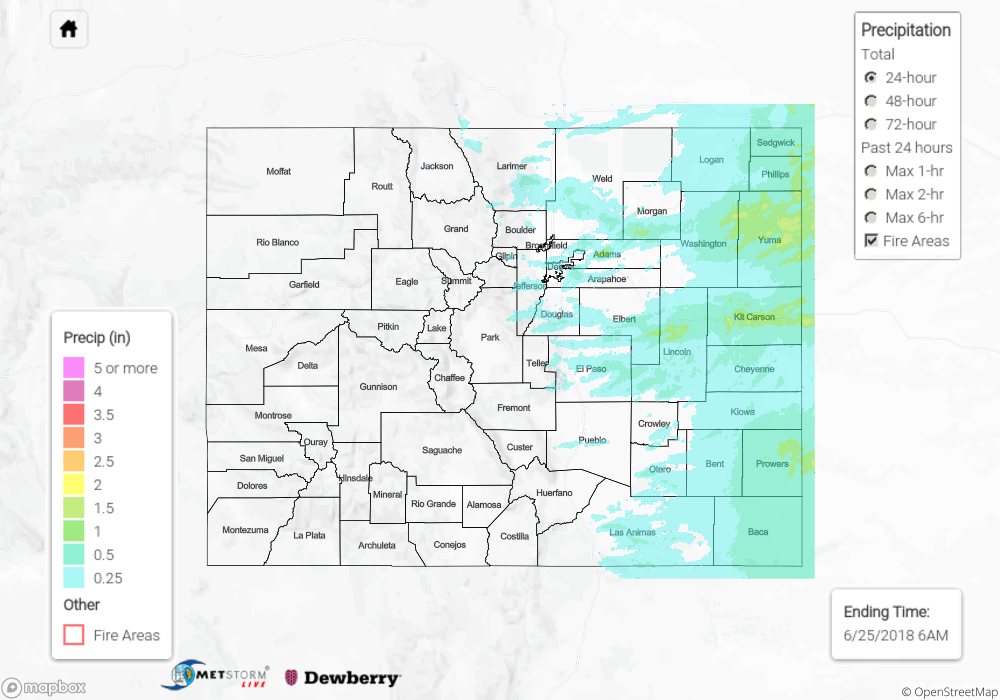
No flash flooding occurred yesterday. For a look at precipitation estimates in your area, please see our State Precipitation Map below.
Click Here For Map Overview
The map below shows radar-estimated, rainfall gage-adjusted Quantitative Precipitation Estimates (QPE) across Colorado. The map is updated daily during the operational season (May 1 – Sep 30) by 11AM. The following six layers are currently available: 24-hour, 48-hour and 72-hour total precipitation, as well as maximum 1-hour, 2-hour and 6-hour precipitation over the past 24 hour period (to estimate where flash flooding may have occurred). The 24-hour, 48-hour and 72-hour total precipitation contain bias corrections that are not disaggregated into the hourly estimates, so there will likely be some differences. The accumulation ending time is 6AM of the date shown in the bottom right corner. Also shown optionally are fire burn areas (post 2012), which are updated throughout the season to include new burn areas. The home button in the top left corner resets the map to the original zoom.