Issue Date: Monday, June 25, 2018
Issue Time: 09:05AM MDT
Summary:
An early morning frontal passage helped keep high temperatures much more comfortable on Sunday. Behind the front, upslope flow helped kick off a round of early afternoon showers and thunderstorms across the Urban Corridor and Northern Mountains/Front Range. Quick, heavy rainfall accompanied the storms and a funnel was reported near Steamboat Springs. With cooler temperatures and extra lift from the trough over WY, there were numerous reports of snow-like, accumulating hail across the Front Range. The hail was small over the Urban Corridor, but it caused some flooding issues as it clogged gutters and pooled water on the roadways. Gages in the area jumped 2-3 feet but were well below the flooding stage. Total rainfall was estimated to be up to 1 inch with the highest UDFCD ALERT gage in Denver recording 0.63 inches (Rocky Mountain Arsenal).
As the front moved south, more showers and thunderstorms were triggered along the higher terrains. As the storms moved east into better moisture, shear and CAPE, they began producing larger hail and gusty winds. In eastern El Paso County, hail up to 2 inches in diameter was reported. Max 1-hour rain rates around 1 inch were estimated by radar. Further east over the plains, rain rates were estimated a bit over 1.5 inches/hour with 24-hour totals just under 2 inches. A CoCoRaHS station in Yuma County recorded 1.75 inches on Sunday. A wind gust of 66 mph was also reported at the Burlington Airport and a gust of 70 mph was recorded at the Lamar Airport. The eastward moving convection made its way out of the state by 11:30 PM, but a few showers lingered over the eastern plains through this morning.
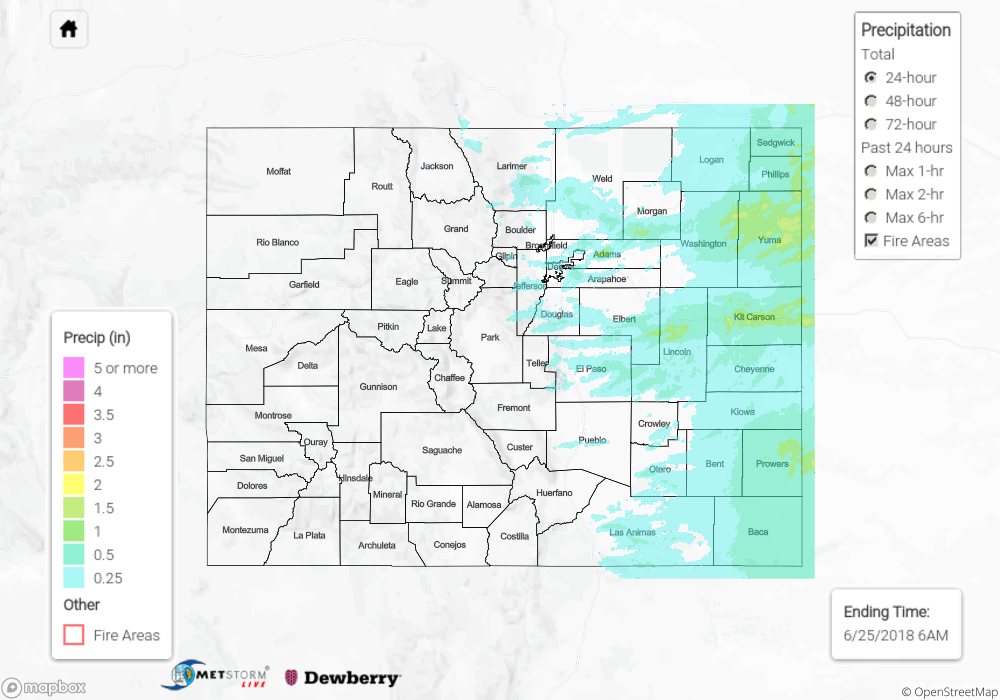
To see how much precipitation fell in your neighborhood on Sunday, scroll down to the State Precipitation Map below.
Click Here For Map Overview