Issue Date: Tuesday, May 1st, 2018
Issue Time: 9:00 AM MDT
Summary:
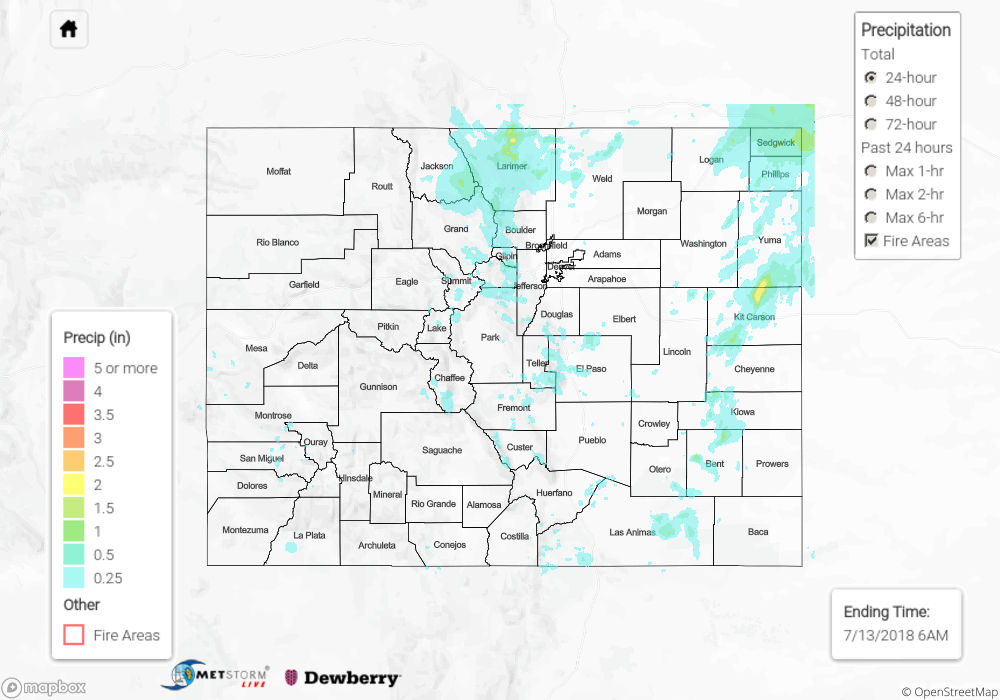
As the upper-level high built over western states yesterday, drier, low-level air was ushered in from the north and west, resulting in a downtick of thunderstorm coverage and intensity across the state. The bulk of the activity was focused over the mountains, mainly over the higher terrain of the Front Range, Southeast Mountains, Central Mountains, Southwest Slope, and San Juan Mountains. Due to the intrusion of dry air, precipitation rates were lessened overall, but enough moisture was able to hang on across the southern third of the state to result in periods of moderate-to-heavy rainfall. The only heavy rainfall report of the day came from 3 miles S of Trimble (La Plata County), where 0.7 inches of rainfall was observed. This occurred very near, but fortunately not directly over, the 416 Fire burn area.
Aside from the mountains, a few isolated thunderstorms developed over the Raton Ridge and far Southeast Plains, where enough moisture was available for daytime heat to work its magic. After sunset, a weak disturbance passed over Southeast Colorado, kicking off a concentrated collection of showers/thunderstorms over the southern Front Range, southern Urban Corridor, Southeast Mountains, and far western sections of the Southeast Plains.
No flash flooding was reported yesterday. For a look at precipitation estimates in your area, please see our State Precipitation Map below.
Click Here For Map Overview
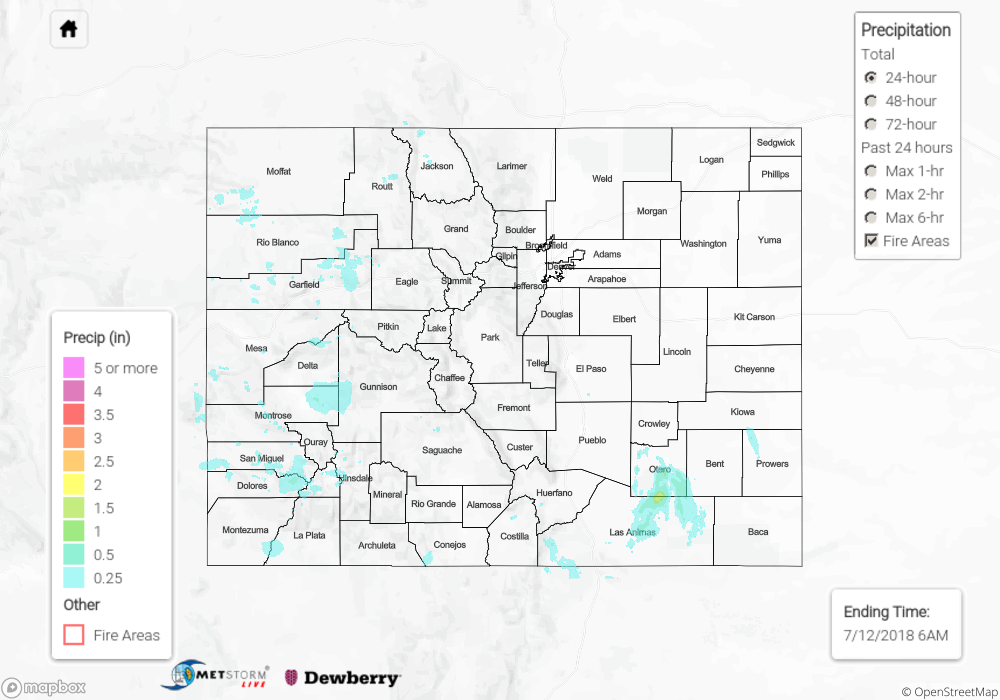
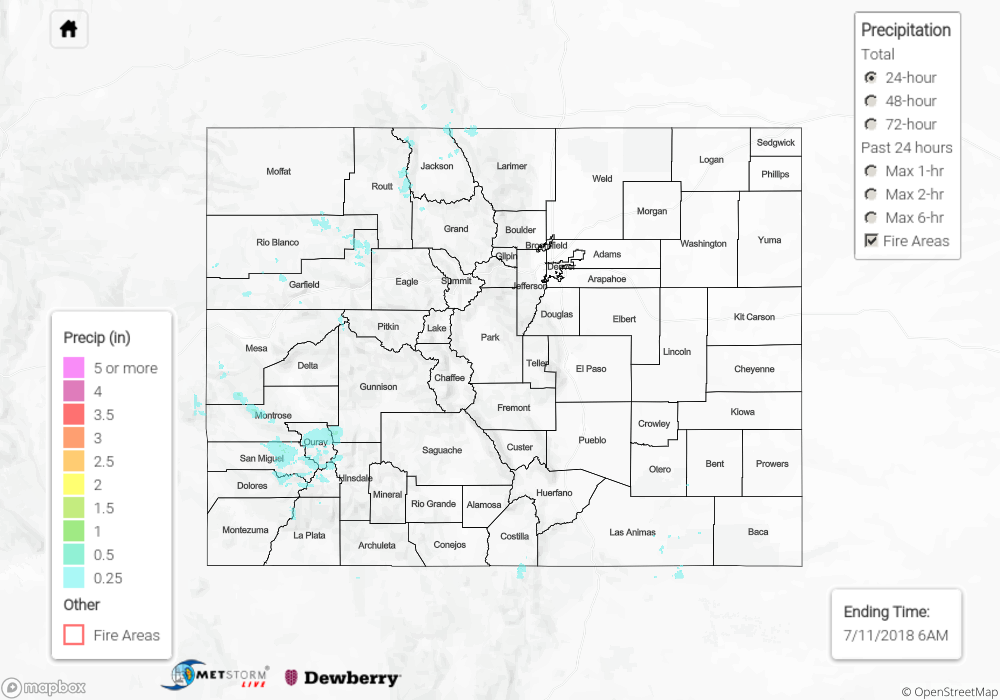
The map below shows radar-estimated, rainfall gage-adjusted Quantitative Precipitation Estimates (QPE) across Colorado. The map is updated daily during the operational season (May 1 – Sep 30) by 11AM. The following six layers are currently available: 24-hour, 48-hour and 72-hour total precipitation, as well as maximum 1-hour, 2-hour and 6-hour precipitation over the past 24 hour period (to estimate where flash flooding may have occurred). The 24-hour, 48-hour and 72-hour total precipitation contain bias corrections that are not disaggregated into the hourly estimates, so there will likely be some differences. The accumulation ending time is 6AM of the date shown in the bottom right corner. Also shown optionally are fire burn areas (post 2012), which are updated throughout the season to include new burn areas. The home button in the top left corner resets the map to the original zoom.