Issue Date: Sunday, July 22nd, 2018
Issue Time: 9:30 AM MDT
Summary:
The hot, July sun was in abundance yesterday, heating up the surface and kicking off scattered showers/thunderstorms across Colorado. Monsoonal moisture backed off a bit as compared to Friday, resulting in storms west of the Divide producing more wind than rain, and keeping the flash flood threat at bay. As day turned to nighttime, monsoonal moisture crept back into western Colorado, keeping scattered showers/weak thunderstorms going over the higher terrain into the morning hours. In fact, a few showers are ongoing at this time north of I-70.
East of the divide, scattered showers/thunderstorms were fueled by an influx of low-level moisture from the Great Plains. Early on in the period, storms produced more wind than rain, as they had to overcome still low values of relative humidity near the surface. As the day wore on, however, storms were able to saturate the lower levels themselves, allowing them to more efficiently get rainfall to the surface. Periods of moderate-to-heavy rain attended the stronger thunderstorms, as well as strong winds (40-65 mph gusts). One hail report was submitted yesterday from 4 miles NNE of Keota (Weld County), where 1.5 inch diameter hail fell around 5:40 PM last night.
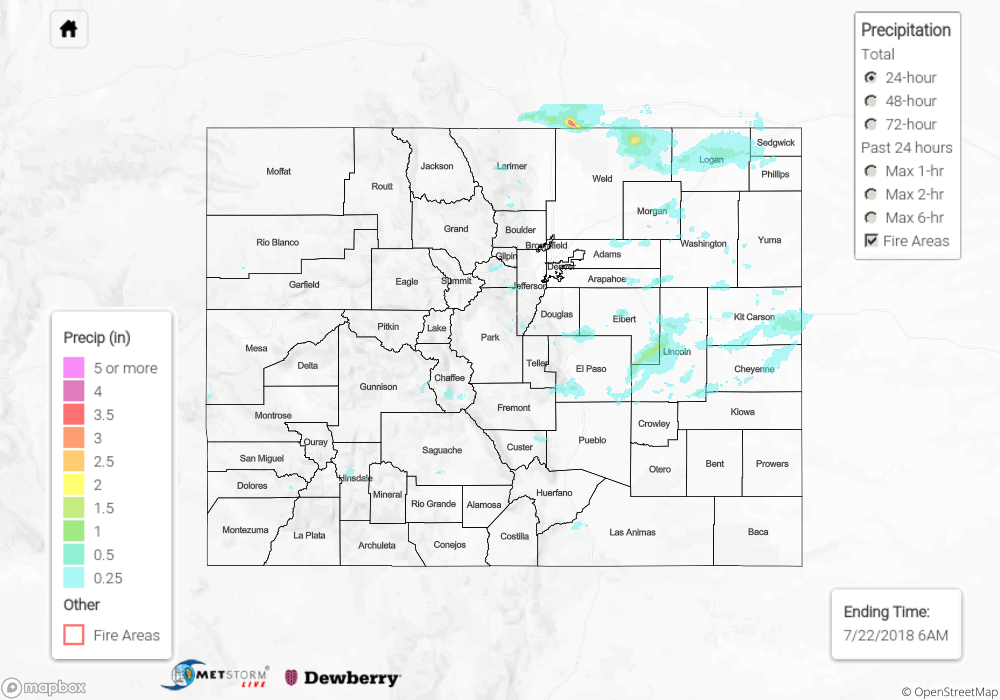
No flash flooding was reported yesterday. For a look at precipitation estimates in your area, please see our State Precipitation Map below.
Click Here For Map Overview
The map below shows radar-estimated, rainfall gage-adjusted Quantitative Precipitation Estimates (QPE) across Colorado. The map is updated daily during the operational season (May 1 – Sep 30) by 11AM. The following six layers are currently available: 24-hour, 48-hour and 72-hour total precipitation, as well as maximum 1-hour, 2-hour and 6-hour precipitation over the past 24 hour period (to estimate where flash flooding may have occurred). The 24-hour, 48-hour and 72-hour total precipitation contain bias corrections that are not disaggregated into the hourly estimates, so there will likely be some differences. The accumulation ending time is 6AM of the date shown in the bottom right corner. Also shown optionally are fire burn areas (post 2012), which are updated throughout the season to include new burn areas. The home button in the top left corner resets the map to the original zoom.