Issue Date: Monday, August 27th, 2018
Issue Time: 09:05 AM MDT
Summary:
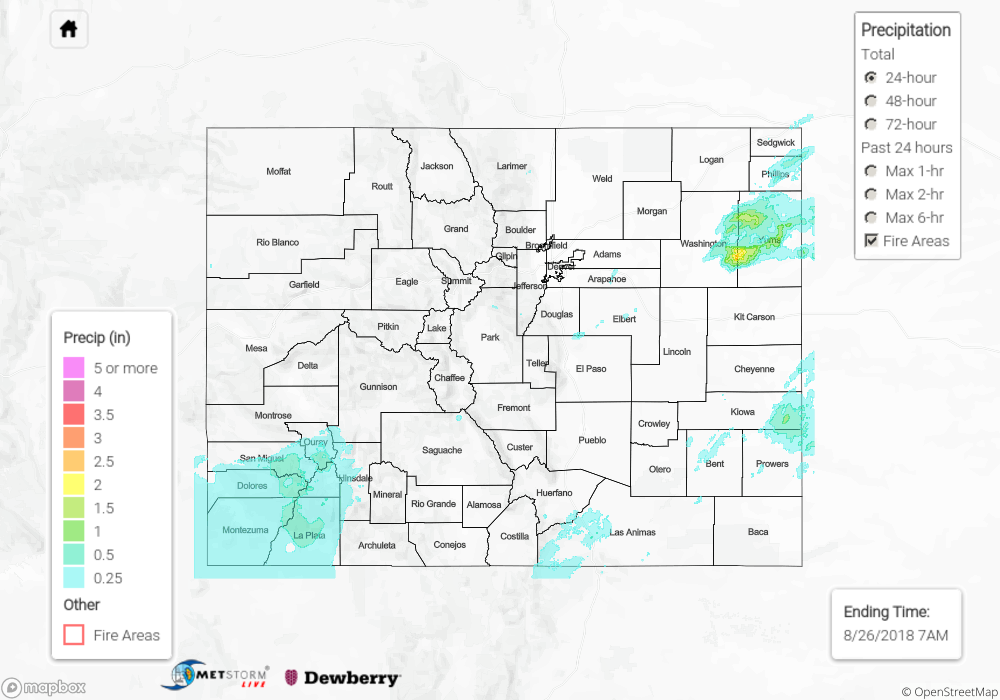
Westerly and southwesterly flow aloft was in place over Colorado on Sunday with the shifting upper-level trough. Drier air embedded with the afternoon shortwave knocked down coverage a bit when compared to Saturday. Quick storm motion also helped limit rainfall totals. With drier low-levels, gusty winds in the 50-60 mph range were reported along the Front Range and Northwest Slope. Over Western Colorado, some stronger storms developed over the Grand Valley and northern Southwest Slope near the CO/UT border. Brief heavy rainfall over an arroyo triggered a mud flow that partially covered the highway near Montrose along Highway 90. Traffic was unaffected by the mud flow at the time of the report (6:20 PM MDT). Small hail was also reported with these storms. Radar rainfall estimates in this area were up to 0.5 inches without any observations in the area.
To see how much precipitation fell over your area yesterday, scroll down to the State Precipitation Map below.
Click Here For Map Overview
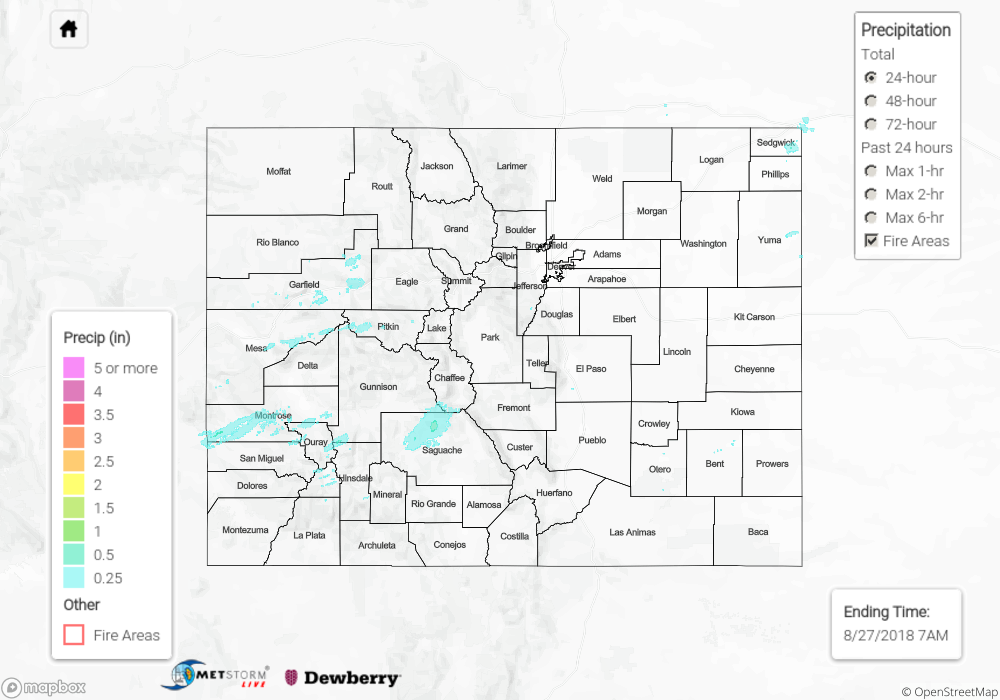
The map below shows radar-estimated, rainfall gage-adjusted Quantitative Precipitation Estimates (QPE) across Colorado. The map is updated daily during the operational season (May 1 – Sep 30) by 11AM. The following six layers are currently available: 24-hour, 48-hour and 72-hour total precipitation, as well as maximum 1-hour, 2-hour and 6-hour precipitation over the past 24 hour period (to estimate where flash flooding may have occurred). The 24-hour, 48-hour and 72-hour total precipitation contain bias corrections that are not disaggregated into the hourly estimates, so there will likely be some differences. The accumulation ending time is 7AM of the date shown in the bottom right corner. Also shown optionally are fire burn areas (post 2012), which are updated throughout the season to include new burn areas. The home button in the top left corner resets the map to the original zoom.