SPM 08-31-2018: Hot, Dry, and Blustery Across the State

Issue Date: Thursday, August 31st, 2018
Issue Time: 10:00 AM MDT

Summary:

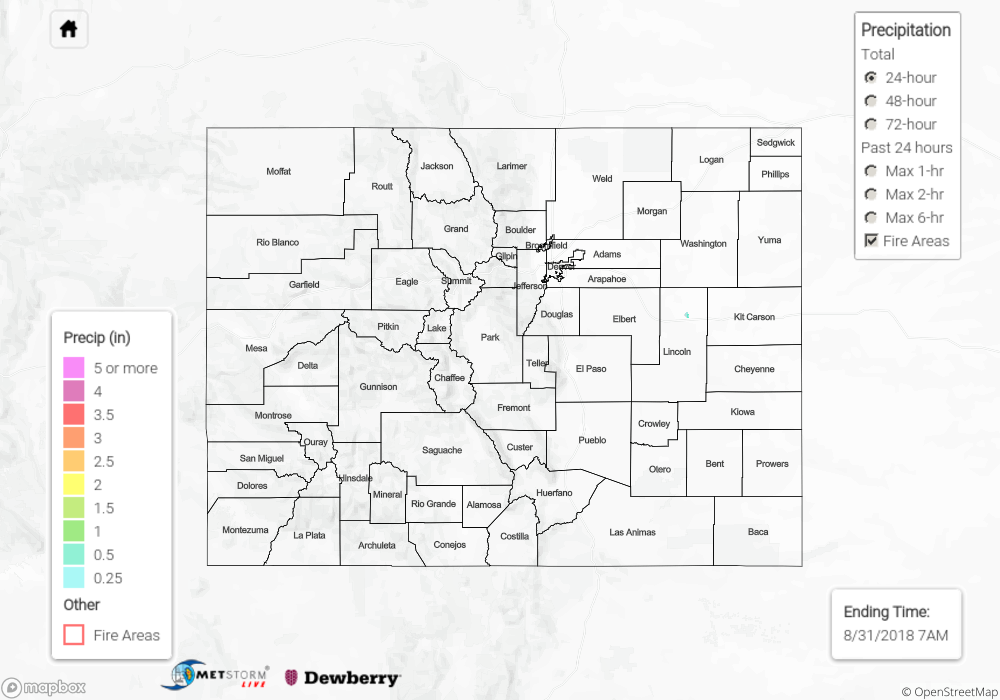
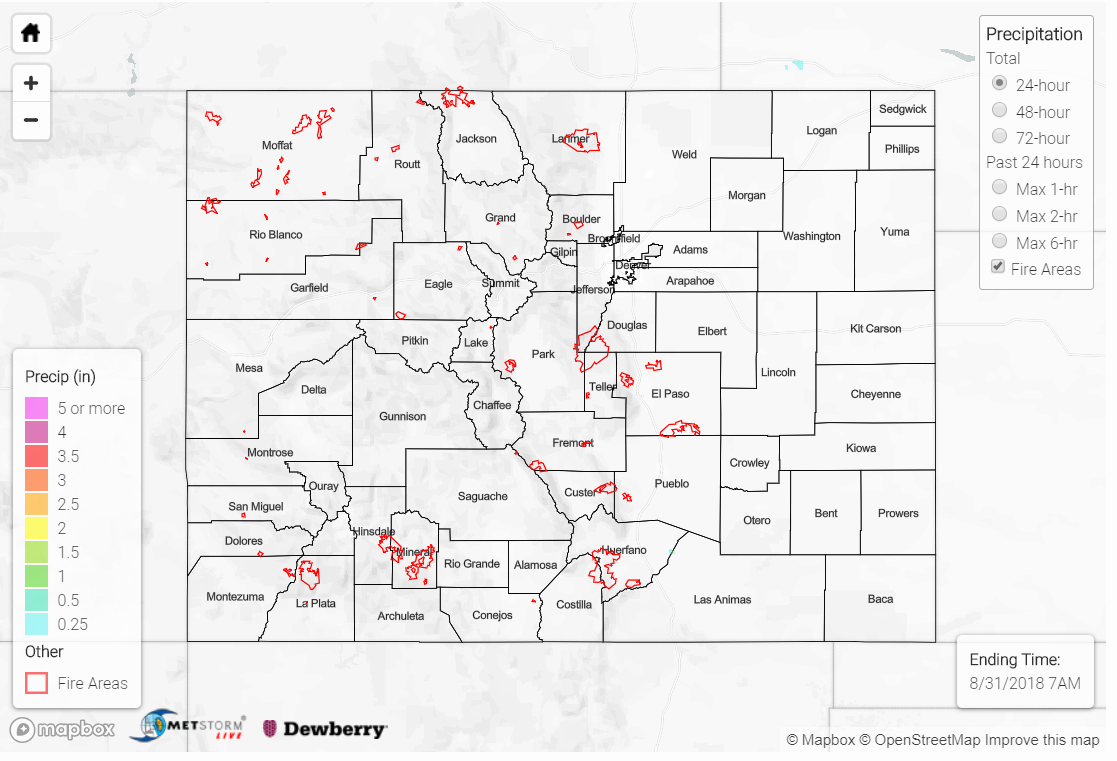
August 30th was another dry, windy day, with temperatures at or above average nearly everywhere across Colorado. As has been the pattern over the past few days, Thursday was even less smoky than it has been since last weekend. Ample sun mixed with an overhead shortwave lead to the development of large cumulus clouds that threatened, but rarely delivered, rainfall. Despite gusty winds throughout the day underneath thunderstorms across the Northwest Plains and across the eastern part of Colorado, there were no wind storm reports. No flooding was reported on Thursday.

Click Here For Map Overview

The map below shows radar-estimated, rainfall gage-adjusted Quantitative Precipitation Estimates (QPE) across Colorado. The map is updated daily during the operational season (May 1 – Sep 30) by 11AM. The following six layers are currently available: 24-hour, 48-hour and 72-hour total precipitation, as well as maximum 1-hour, 2-hour and 6-hour precipitation over the past 24 hour period (to estimate where flash flooding may have occurred). The accumulation ending time is 6AM of the date shown in the bottom right corner. Also shown optionally are fire burn areas since 2012. The home button in the top left corner resets the map to the original zoom.

Note: We have identified a possible underestimation in QPE over the southwest part of the state. We are working to on this issue, and will provide an update as soon as possible.

SPM 08-30-2018: Lone Storm Fires Along the Cheyenne Ridge

Issue Date: Thursday, August 30th, 2018
Issue Time: 10:10 AM MDT

Summary:

Repeat pattern to Tuesday minus the cooler temperatures. High temperatures rebounded to around seasonal values under the weak ridging pattern. Across the state, skies were clear with minimal smoke blocking visibility. While more instability was able to build with the clearer skies, lack of low-level moisture continued to limit shower and thunderstorm development. By mid-afternoon a storm fired over the Cheyenne Ridge with the south/southeast surface flow. As the high-based storm moved eastward into the NE panhandle, some light showers fell along the CO/WY border. While there were no surface observations in the area, likely only trace amounts reached the ground. The lone storm of the day eventually dissipated as instability faded with the setting sun.

To see how much precipitation fell over your neighborhood the last 72-hours, scroll down to the State Precipitation Map below.

Click Here For Map Overview

The map below shows radar-estimated, rainfall gage-adjusted Quantitative Precipitation Estimates (QPE) across Colorado. The map is updated daily during the operational season (May 1 – Sep 30) by 11AM. The following six layers are currently available: 24-hour, 48-hour and 72-hour total precipitation, as well as maximum 1-hour, 2-hour and 6-hour precipitation over the past 24 hour period (to estimate where flash flooding may have occurred). The 24-hour, 48-hour and 72-hour total precipitation contain bias corrections that are not disaggregated into the hourly estimates, so there will likely be some differences. The accumulation ending time is 7AM of the date shown in the bottom right corner. Also shown optionally are fire burn areas (post 2012), which are updated throughout the season to include new burn areas. The home button in the top left corner resets the map to the original zoom.

SPM 08-29-2018: Cold Front is a Friendly Reminder that Fall is Around the Corner

Issue Date: Wednesday, August 29th, 2018
Issue Time: 09:35 AM MDT

Summary:

Cool, crisp start to Tuesday morning after a cold front moved through overnight. Temperatures yesterday were about 10-15F cooler than Monday. Moisture return with the front was weak and instability insignificant, so despite upslope flow returning to the forecast, shower and thunderstorm development was nixed on Tuesday. Surface winds also decreased, which dropped the critical fire weather criteria. Overall, the cool temperatures and clear skies were welcomed weather as we approach the end of August.

To see how much precipitation fell over your neighborhood the last 72-hours, scroll down to the State Precipitation Map below.

Click Here For Map Overview

The map below shows radar-estimated, rainfall gage-adjusted Quantitative Precipitation Estimates (QPE) across Colorado. The map is updated daily during the operational season (May 1 – Sep 30) by 11AM. The following six layers are currently available: 24-hour, 48-hour and 72-hour total precipitation, as well as maximum 1-hour, 2-hour and 6-hour precipitation over the past 24 hour period (to estimate where flash flooding may have occurred). The 24-hour, 48-hour and 72-hour total precipitation contain bias corrections that are not disaggregated into the hourly estimates, so there will likely be some differences. The accumulation ending time is 7AM of the date shown in the bottom right corner. Also shown optionally are fire burn areas (post 2012), which are updated throughout the season to include new burn areas. The home button in the top left corner resets the map to the original zoom.

SPM 08-28-2018: Gusty Winds Statewide

Issue Date: Tuesday, August 28th, 2018
Issue Time: 09:15 AM MDT

Summary:

Westerly flow aloft pulled in dry air from the west and created downsloping winds to the east, which limited rainfall on Monday. A passing jet also mixed down some strong winds to the surface and created fire weather over the northern half of the state. Thankfully, no new fires were reported as of this morning. The highest gust from yesterday was at Monarch Pass where a gust of 70 mph was recorded. Here are some other impressive high gusts from yesterday, since the max precipitation was under 0.1 inches (western high country).

Rocky Flats: 68 mph
Jeffco Airport: 62 mph
Denver International Airport: 60 mph
Douglass Pass (Garfield County): 54 mph
Meeker Airport: 53 mph

To see how much precipitation fell over your neighborhood the last 72-hours, scroll down to the State Precipitation Map below.

Click Here For Map Overview

The map below shows radar-estimated, rainfall gage-adjusted Quantitative Precipitation Estimates (QPE) across Colorado. The map is updated daily during the operational season (May 1 – Sep 30) by 11AM. The following six layers are currently available: 24-hour, 48-hour and 72-hour total precipitation, as well as maximum 1-hour, 2-hour and 6-hour precipitation over the past 24 hour period (to estimate where flash flooding may have occurred). The 24-hour, 48-hour and 72-hour total precipitation contain bias corrections that are not disaggregated into the hourly estimates, so there will likely be some differences. The accumulation ending time is 7AM of the date shown in the bottom right corner. Also shown optionally are fire burn areas (post 2012), which are updated throughout the season to include new burn areas. The home button in the top left corner resets the map to the original zoom.