Issue Date: Wednesday, August 29th, 2018
Issue Time: 09:35 AM MDT
Summary:
Cool, crisp start to Tuesday morning after a cold front moved through overnight. Temperatures yesterday were about 10-15F cooler than Monday. Moisture return with the front was weak and instability insignificant, so despite upslope flow returning to the forecast, shower and thunderstorm development was nixed on Tuesday. Surface winds also decreased, which dropped the critical fire weather criteria. Overall, the cool temperatures and clear skies were welcomed weather as we approach the end of August.
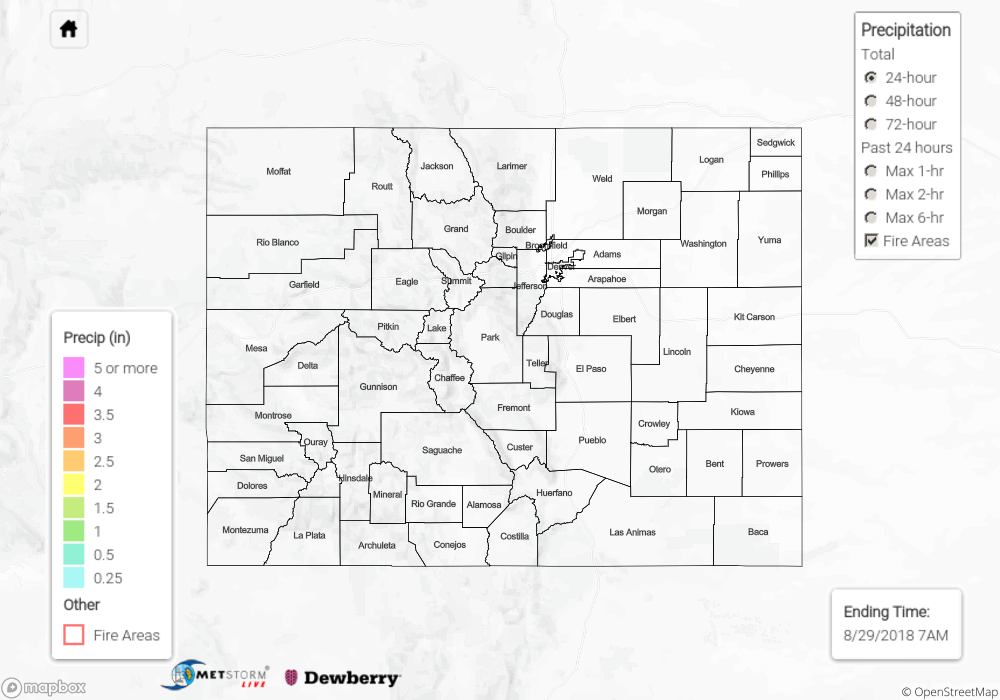
To see how much precipitation fell over your neighborhood the last 72-hours, scroll down to the State Precipitation Map below.
Click Here For Map Overview
The map below shows radar-estimated, rainfall gage-adjusted Quantitative Precipitation Estimates (QPE) across Colorado. The map is updated daily during the operational season (May 1 – Sep 30) by 11AM. The following six layers are currently available: 24-hour, 48-hour and 72-hour total precipitation, as well as maximum 1-hour, 2-hour and 6-hour precipitation over the past 24 hour period (to estimate where flash flooding may have occurred). The 24-hour, 48-hour and 72-hour total precipitation contain bias corrections that are not disaggregated into the hourly estimates, so there will likely be some differences. The accumulation ending time is 7AM of the date shown in the bottom right corner. Also shown optionally are fire burn areas (post 2012), which are updated throughout the season to include new burn areas. The home button in the top left corner resets the map to the original zoom.