Issue Date: Monday, September 24th, 2018
Issue Time: 10:05 AM MDT
Summary:
Not much action yesterday as WSW flow aloft continued to entrain the dry air mass over Utah into the state. There was still enough moisture for some high clouds over the mountains in the afternoon, which helped provide some shade from the warm temperatures. For the first day of fall, it sure felt more like summer. By the late afternoon, the trough to our west began its migration eastward. The upper-level jet associated with the trough mixed some strong surface winds over northwest Colorado, so a Red Flag Warning was issued. None of this was helpful for containment of the Ryan and Silver Creek fires. A gusty of 59 mph was recorded at the Douglas Pass ASOS with a gust of 45 mph recorded at the Craig ASOS during the early evening hours. While there were some showers associated with the right entrance region of the jet later in the evening, they were high-based and produced some gusty winds. Precipitation totals slowly increased overnight as earlier showers helped wet the lower levels of the atmosphere as well as a cold front passage. Radar rainfall estimates were highest over the northwest Northern Mountains where estimations were around 0.3 inches. The Dry Lake SNOTEL site near Steamboat recorded 0.2 inches for the 24-hour period. Totals just over 0.1 inches were estimated over the Central Mountains from the overnight/early morning rainfall. Unfortunately, these low totals also did not do much to help with the containment of the ongoing fires.
To see how much rain fell over your area yesterday, scroll down to the State Precipitation Map below.
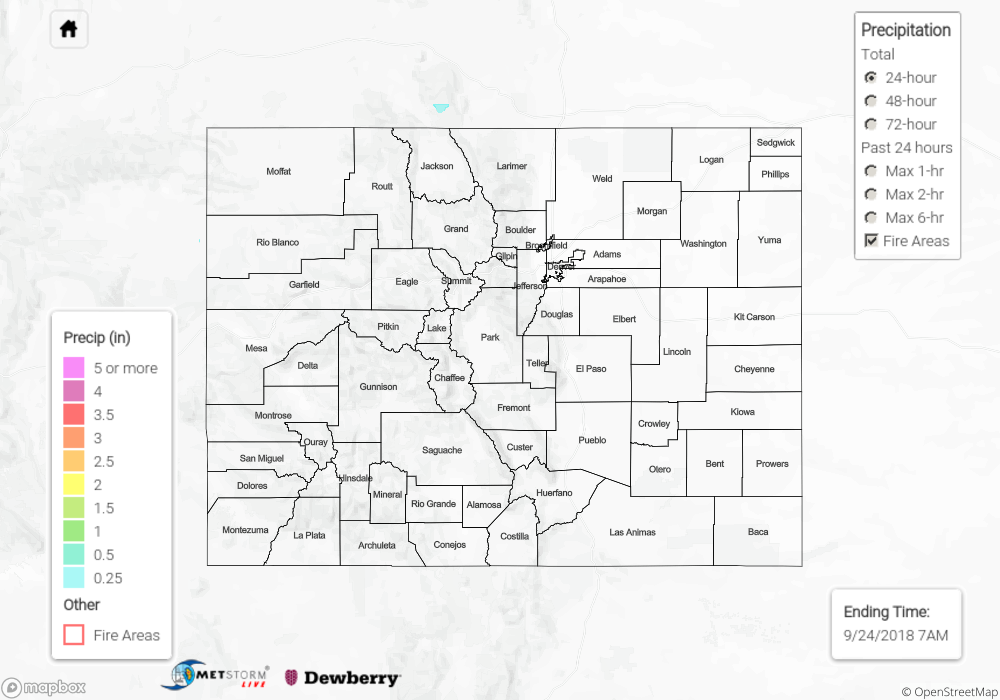
Click Here For Map Overview
The map below shows radar-estimated, rainfall gage-adjusted Quantitative Precipitation Estimates (QPE) across Colorado. The map is updated daily during the operational season (May 1 – Sep 30) by 11AM. The following six layers are currently available: 24-hour, 48-hour and 72-hour total precipitation, as well as maximum 1-hour, 2-hour and 6-hour precipitation over the past 24 hour period (to estimate where flash flooding may have occurred). The 24-hour, 48-hour and 72-hour total precipitation contain bias corrections that are not disaggregated into the hourly estimates, so there will likely be some differences. The accumulation ending time is 7AM of the date shown in the bottom right corner. Also shown optionally are fire burn areas (post 2012), which are updated throughout the season to include new burn areas. The home button in the top left corner resets the map to the original zoom.