SPM 05-01-2019: Statewide Snow and Rain

Issue Date: Wednesday, May 1st, 2019
Issue Time: 9:30AM MDT

Summary:

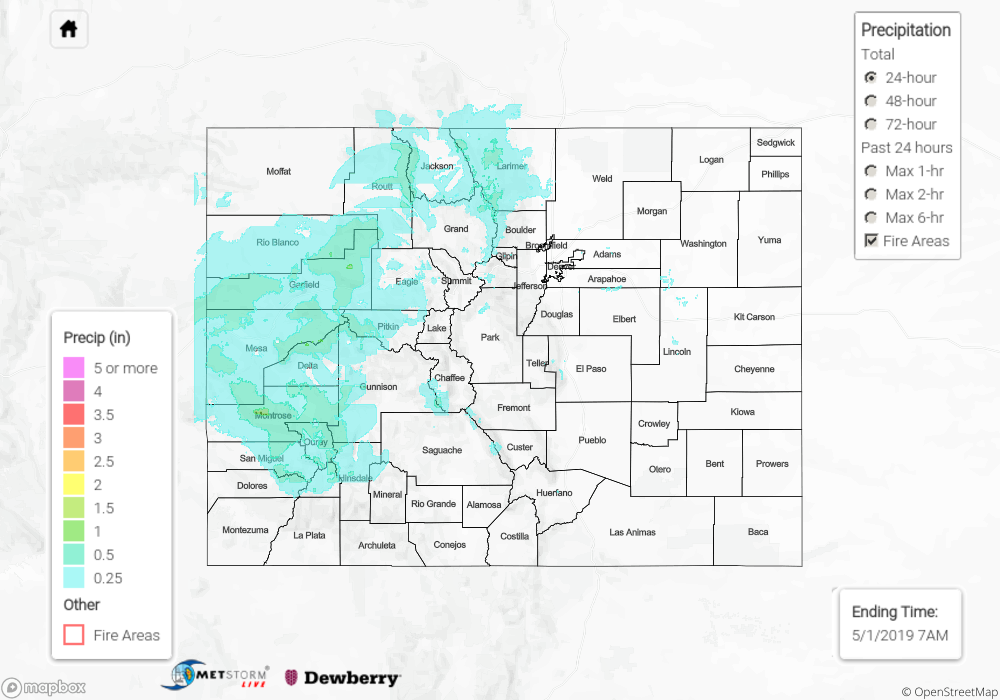
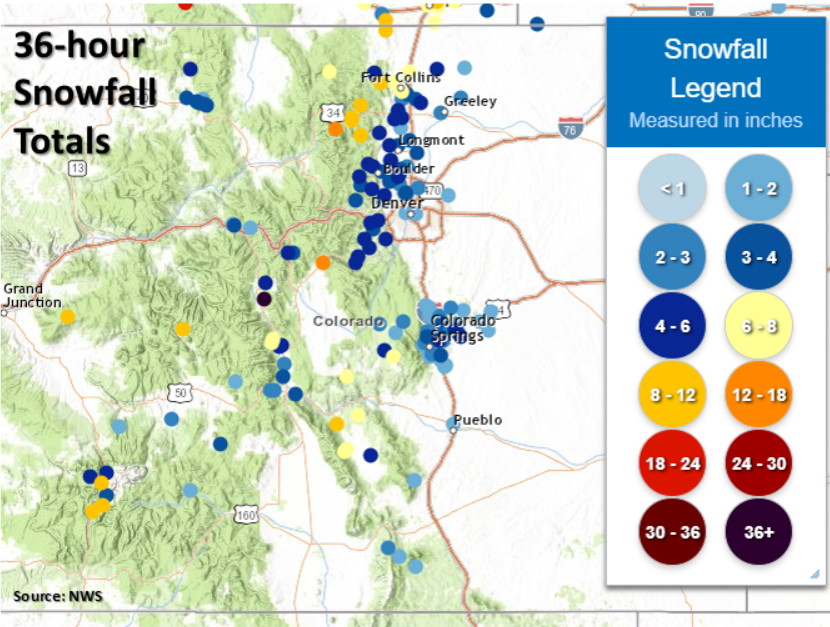
Almost every county across the state received some form of precipitation yesterday. A vorticity max associated with the trough was located over the central portion of the state, and with decent moisture in place, the extra lift was able to produce widespread showers and snowfall. The precipitation fell as snow across the higher elevations with the Front Range and Southeast Mountains receiving 2-8 inches over the last 36 hours. Heavier 24-hour totals were reported over the San Juan and Central Mountains with reports in the 4-10 inch range (see map below). The season of incredible snowfall continues! Tune into the FTO tomorrow for longer and more detailed recap. While the Urban Corridor also saw some snowflakes, most were not able to stick due to ground temperatures above freezing. Overall, temperatures were still a bit below normal. Highs over the Denver Metro area were around 50F, while the eastern plains and western lower elevations reached 60F.

For precipitation estimates in your neighborhood on Tuesday, scroll down to the State Precipitation Map below.

Click Here For Map Overview

The map below shows radar-estimated, rainfall gage-adjusted Quantitative Precipitation Estimates (QPE) across Colorado. The map is updated daily during the operational season (May 1 – Sep 30) by 11AM. The following six layers are currently available: 24-hour, 48-hour and 72-hour total precipitation, as well as maximum 1-hour, 2-hour and 6-hour precipitation over the past 24 hour period (to estimate where flash flooding may have occurred). The 24-hour, 48-hour and 72-hour total precipitation contain bias corrections that are not disaggregated into the hourly estimates, so there will likely be some differences. The accumulation ending time is 7AM of the date shown in the bottom right corner. Also shown optionally are vulnerable fire burn areas (post 2012), which are updated throughout the season to include new, vulnerable burn areas. The home button in the top left corner resets the map to the original zoom.

SPM 10-03-2018: Rosa Brings a Surge of Late Season Subtropical Moisture to Western Colorado

Issue Date: Wednesday, October 3rd, 2018
Issue Time: 09:55 AM MDT

Summary:

The main axis of subtropical moisture moved into western Colorado yesterday, which brought beneficial, widespread rainfall to the western slope. Rainfall began during the early morning hours over the San Juan and Central Mountains and moved north throughout the day. As storms moved to the north, they became more isolated in nature and higher totals were confined to the mountains. A second set of showers moved into the southwest corner during the evening hours, but limited instability kept storms more isolated and less convective in nature than forecast. Storm motion was fairly quick and with more stratiform rainfall, rather than convective rainfall, the ground was able to soak up most of the moisture.

The western slope is experiencing either extreme or exceptional drought conditions, so yesterday’s boost of moisture helped make some headway with the drought after a very dry September. Totals over western Colorado were generally in the 0.25 to 0.5 inch range with higher totals over steeper terrains. Radar rainfall estimates were just over 1.5 inches in northern Delta County with totals just over 1 inch in the San Juan Mountains. The largest CoCoRaHS observation for the day was over Gunnison County near Crested Butte, which was 1.32 inches. The Columbus Basin SNOTEL site near Lewis Mountain (north of Hesperus, CO) recorded 1.9 inches for the 24-hour period. Thankfully, 1-hour rain rates yesterday were less than 0.5 inches, so there was not much of a flood threat even for recent burn scars. Flooding was not reported on Tuesday.

To see how much rain fell over your neighborhood yesterday, scroll down to the State Precipitation Map below.

Click Here For Map Overview

The map below shows radar-estimated, rainfall gage-adjusted Quantitative Precipitation Estimates (QPE) across Colorado. The map is updated daily during the operational season (May 1 – Sep 30) by 11AM. The following six layers are currently available: 24-hour, 48-hour and 72-hour total precipitation, as well as maximum 1-hour, 2-hour and 6-hour precipitation over the past 24 hour period (to estimate where flash flooding may have occurred). The 24-hour, 48-hour and 72-hour total precipitation contain bias corrections that are not disaggregated into the hourly estimates, so there will likely be some differences. The accumulation ending time is 7AM of the date shown in the bottom right corner. Also shown optionally are fire burn areas (post 2012), which are updated throughout the season to include new burn areas. The home button in the top left corner resets the map to the original zoom.

SPM 09-30-2018: Warm and Dry During the Day, Cool Front Pushed Southward Overnight

Issue Date: Sunday, September 30th, 2018
Issue Time: 9:30 AM MDT

Summary:

NOTE: This is the last scheduled State Precipitation Map (SPM) discussion of the 2018 season. However, additional discussions may be necessary this next week to cover the heavy rainfall threat possible across Western Colorado. If a flood threat appears, we will be doing special Flood Threat Bulletin(s), and SPM discussions, as warranted.

The main weather stories during the day yesterday were (1) the wild swing upward in high temperatures across eastern Colorado, where highs were 20-35°F warmer than the day before, and (2) the elevated fire danger brought on by warm, dry, and breezy conditions, especially over the High Country. Overnight and this morning, a weak surface low and attendant cold front pushed southward through eastern Colorado and brought low clouds, fog, and a few pockets of light drizzle to the eastern plains. The drizzle did not result in anything more than a trace accumulation, and was the only precipitation that Mother Nature could muster over the last 24 hours.

No flash flooding was reported yesterday. For a look at precipitation estimates in your area, please see the State Precipitation Map below.

Click Here For Map Overview

The map below shows radar-estimated, rainfall gage-adjusted Quantitative Precipitation Estimates (QPE) across Colorado. The map is updated daily during the operational season (May 1 – Sep 30) by 11AM. The following six layers are currently available: 24-hour, 48-hour and 72-hour total precipitation, as well as maximum 1-hour, 2-hour and 6-hour precipitation over the past 24 hour period (to estimate where flash flooding may have occurred). The 24-hour, 48-hour and 72-hour total precipitation contain bias corrections that are not disaggregated into the hourly estimates, so there will likely be some differences. The accumulation ending time is 7AM of the date shown in the bottom right corner. Also shown optionally are fire burn areas (post 2012), which are updated throughout the season to include new burn areas. The home button in the top left corner resets the map to the original zoom.

SPM 09-29-2018: Taste of Fall for Eastern Colorado

Issue Date: Saturday, September 29th, 2018
Issue Time: 9:30 AM MDT

Summary:

A shallow cold front pushed through eastern Colorado yesterday, providing a day filled with low clouds across much of the area. High temperatures struggled to get into the 50s, with much of the eastern plains remaining in the 40s throughout the day. There wasn’t enough moisture to get any showers going, except a light sprinkle or two across northeast Colorado. The cold air was only about 1000-1500 feet deep, so the High Country remained under the influence of sunshine and mostly sunny skies, with high temperatures similar to those of Thursday.

No flash flooding was reported yesterday. For a look at precipitation estimates in your area, please see the State Precipitation Map below.

Click Here For Map Overview

The map below shows radar-estimated, rainfall gage-adjusted Quantitative Precipitation Estimates (QPE) across Colorado. The map is updated daily during the operational season (May 1 – Sep 30) by 11AM. The following six layers are currently available: 24-hour, 48-hour and 72-hour total precipitation, as well as maximum 1-hour, 2-hour and 6-hour precipitation over the past 24 hour period (to estimate where flash flooding may have occurred). The 24-hour, 48-hour and 72-hour total precipitation contain bias corrections that are not disaggregated into the hourly estimates, so there will likely be some differences. The accumulation ending time is 7AM of the date shown in the bottom right corner. Also shown optionally are fire burn areas (post 2012), which are updated throughout the season to include new burn areas. The home button in the top left corner resets the map to the original zoom.