Issue Date: Saturday, September 14th, 2019
Issue Time: 9:10 AM MDT
Summary:
Plenty of sunshine and pleasant temperatures were the main weather story yesterday, thanks to a ribbon of dry air that extended from southern California to Iowa. This dry air kept skies mainly cloud free, but as is typical for Colorado, Mother Nature had one curveball for everyone. A weak disturbance shifted across far southern Colorado during the afternoon/evening hours and kicked off an isolated, strong thunderstorm over the Raton Ridge. Lightning, small hail, gusty winds, and periods of moderate rainfall were the main impacts as the storm rumbled east along Highway 160 for a few hours, finally dissipating shortly after sunset. No severe storm reports were submitted to the National Weather Service from this storm.
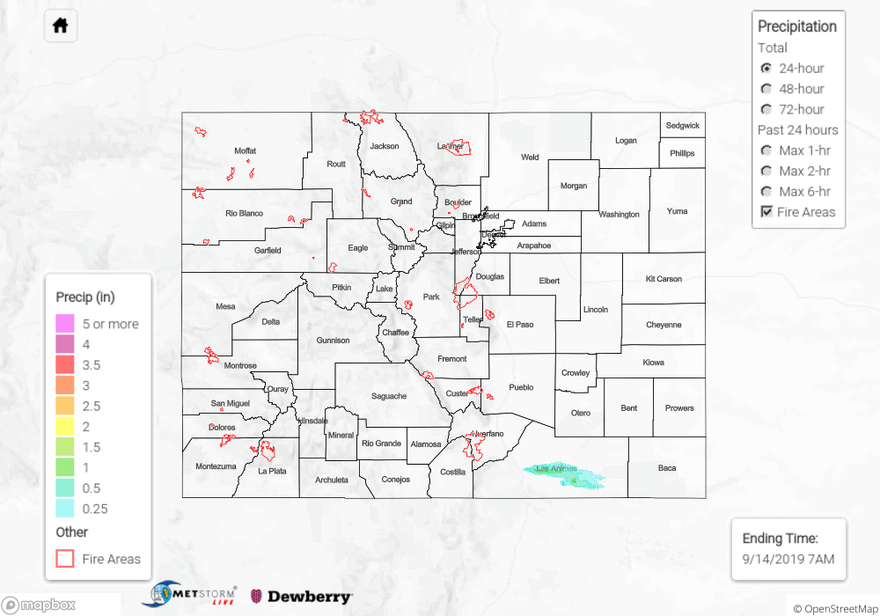
No flash flooding was reported yesterday. For a look at precipitation estimates in your area, please see the State Precipitation Map below.
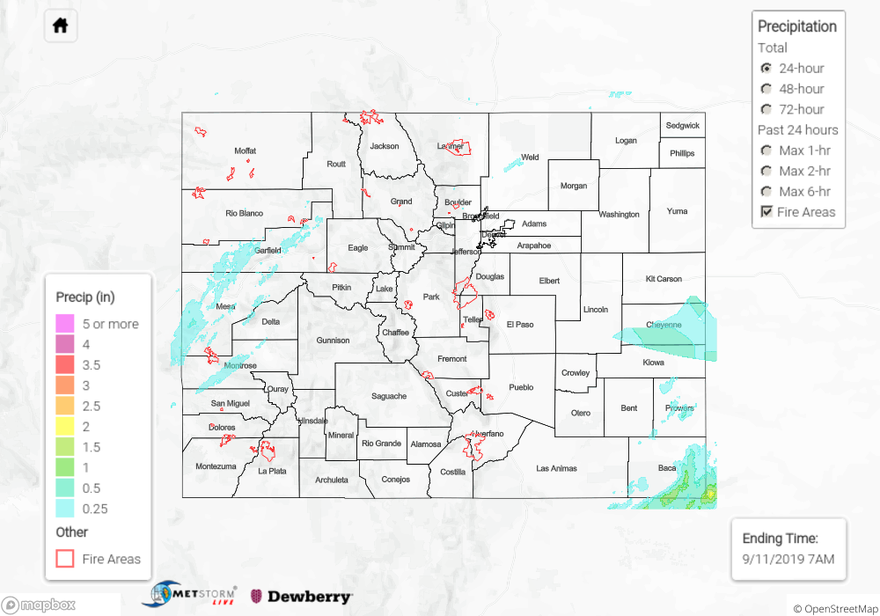
Click Here For Map Overview
The map below shows radar-estimated, rainfall gage-adjusted Quantitative Precipitation Estimates (QPE) across Colorado. The map is updated daily during the operational season (May 1 – Sep 30) by 11AM. The following six layers are currently available: 24-hour, 48-hour and 72-hour total precipitation, as well as maximum 1-hour, 2-hour and 6-hour precipitation over the past 24 hour period (to estimate where flash flooding may have occurred). The 24-hour, 48-hour and 72-hour total precipitation contain bias corrections that are not disaggregated into the hourly estimates, so there will likely be some differences. The accumulation ending time is 7AM of the date shown in the bottom right corner. Also shown optionally are vulnerable fire burn areas (post 2012), which are updated throughout the season to include new, vulnerable burn areas. The home button in the top left corner resets the map to the original zoom.