SPM 05-20-2020: Rainfall for the Southeast Plains

Issue Date: Wednesday, May 20th, 2020
Issue Time: 10AM MDT

Summary:

Winds picked up yesterday as the Low started to move west with gusts between 45 and 60 mph recorded across the state. A 68 mph gust was recorded at 3:10PM at Durango’s airport! It was another hot one with highs on par or slightly above Monday. Alamosa beat its daily record for a 3rd day in a row, but it’s not looking likely that record will be beat again this afternoon. Temperatures will be cooling down quite a bit tomorrow and a few degrees today, so it looks like this record breaking heat wave will (thankfully) come to an end.

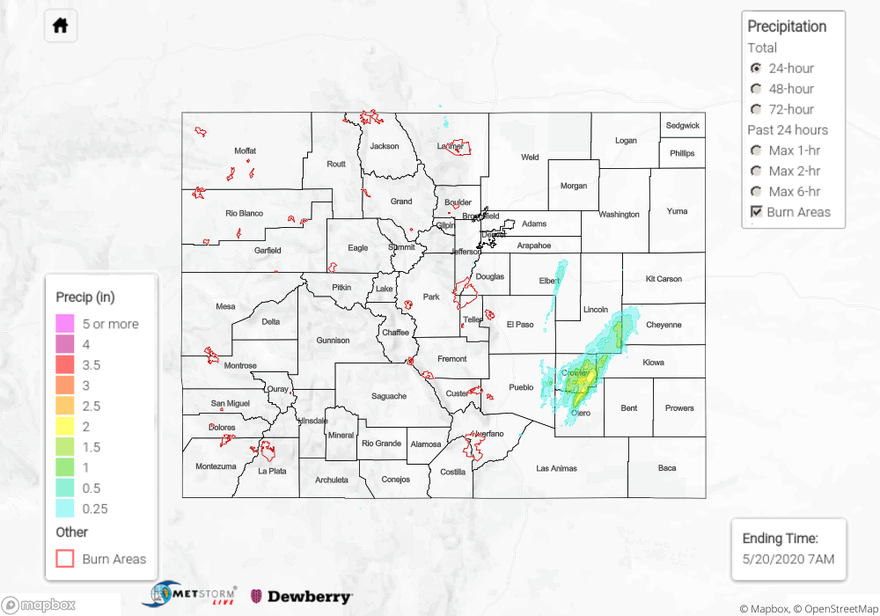
A weak northward surge of moisture helped bring showers and thunderstorms back into the forecast for eastern CO. Storms over the mountains produced more wind than wetting rainfall. Totals were highest near the Continental Divide in the Northern Mountains where up to 0.5 inches fell. Some severe storms popped up over the Southeast Plains just after 4PM and hung around through 11PM. The nearly stationary storms (that formed on a line of convergence) produced totals around 2-2.5 inches in Crowley County. The Rocky Ford CO agriculture gage showed 1.02 inches for the 24-hour period, and CoCoRaHs in town had just under 1.5 inches. There may have been some hail contamination with some of the gages, but overall, some very much needed and impressive rainfall! Flooding was not reported with these storms as of the time of this posting, but a Flash Flood Warning was issued at 8:45PM.

For precipitation estimates in your area over the last 24-hours, scroll down to the State Precipitation Map below.

Click Here For Map Overview

The map below shows radar-estimated, rainfall gage-adjusted Quantitative Precipitation Estimates (QPE) across Colorado. The map is updated daily during the operational season (May 1 – Sep 30) by 11AM. The following six layers are currently available: 24-hour, 48-hour and 72-hour total precipitation, as well as maximum 1-hour, 2-hour and 6-hour precipitation over the past 24 hour period (to estimate where flash flooding may have occurred). The 24-hour, 48-hour and 72-hour total precipitation contain bias corrections that are not disaggregated into the hourly estimates, so there will likely be some differences. The accumulation ending time is 7AM of the date shown in the bottom right corner. Also shown optionally are vulnerable fire burn areas (post 2012), which are updated throughout the season to include new, vulnerable burn areas. The home button in the top left corner resets the map to the original zoom.

SPM 05-19-2020: Summer Sizzle

Issue Date: Tuesday, May 19th, 2020
Issue Time: 9:20AM MDT

Summary:

Quite the warm day as many places reached the 90F mark for the first time this year. The warmest temperatures I saw were near the La Junta area with reports around 93F. Grand Junction reached 91F, and Alamosa beat it’s daily record for a second day in a row (84F and 87F, respectively). This warm start is looking a bit like 2018, although snowpack was a lot higher this winter. There was no moisture around for afternoon storms, although there may have been some light sprinkles over the Palmer Ridge. The virga helped create a beautiful sunset for the Urban Corridor. However, these early season hot temperatures and lack of rainfall are definitely worrisome with the current drought situation.

For precipitation estimates in your neighborhood over the last 24- to 72-hours, scroll down to the State Precipitation Map below.

Click Here For Map Overview

The map below shows radar-estimated, rainfall gage-adjusted Quantitative Precipitation Estimates (QPE) across Colorado. The map is updated daily during the operational season (May 1 – Sep 30) by 11AM. The following six layers are currently available: 24-hour, 48-hour and 72-hour total precipitation, as well as maximum 1-hour, 2-hour and 6-hour precipitation over the past 24 hour period (to estimate where flash flooding may have occurred). The 24-hour, 48-hour and 72-hour total precipitation contain bias corrections that are not disaggregated into the hourly estimates, so there will likely be some differences. The accumulation ending time is 7AM of the date shown in the bottom right corner. Also shown optionally are vulnerable fire burn areas (post 2012), which are updated throughout the season to include new, vulnerable burn areas. The home button in the top left corner resets the map to the original zoom.

SPM 05-18-2020: A Couple Severe Thunderstorms for Herfano & Las Animas Counties

Issue Date: Monday, May 18th, 2020
Issue Time: 9:10AM MDT

Summary:

Warm temperatures and pleasant weather yesterday as the ridge started to build over the state. Increasing southwest flow continued to mix out the remaining moisture over Colorado, especially west of the divide. There was still some available moisture for weak rainfall over the southern Front Range and Southeast Mountains during the evening hours. The heaviest rainfall was over the Raton Ridge where radar estimates just over a half inch of rain fell. These storms formed around 3:30PM and produced 1-inch diameter hail. Flooding was not reported.

For precipitation estimates in your neighborhood over the last 24- to 72-hours, scroll down to the State Precipitation Map below.

Click Here For Map Overview

The map below shows radar-estimated, rainfall gage-adjusted Quantitative Precipitation Estimates (QPE) across Colorado. The map is updated daily during the operational season (May 1 – Sep 30) by 11AM. The following six layers are currently available: 24-hour, 48-hour and 72-hour total precipitation, as well as maximum 1-hour, 2-hour and 6-hour precipitation over the past 24 hour period (to estimate where flash flooding may have occurred). The 24-hour, 48-hour and 72-hour total precipitation contain bias corrections that are not disaggregated into the hourly estimates, so there will likely be some differences. The accumulation ending time is 7AM of the date shown in the bottom right corner. Also shown optionally are vulnerable fire burn areas (post 2012), which are updated throughout the season to include new, vulnerable burn areas. The home button in the top left corner resets the map to the original zoom.

SPM 05-17-2020: A Few Thunderstorms Rumbled

Issue Date: Sunday, May 17th, 2020
Issue Time: 9:00 AM MDT

Summary:

A ridge of high pressure built in from the west yesterday, ushering a disturbance out of Colorado and into the central United States. The high pressure presented locations west of the Continental Divide with warm and dry conditions. Before the disturbance left the state, it helped trigger the development of a few scattered showers and thunderstorms to the east, mainly over the Southeast Mountains, Raton Ridge, southern portions of the Front Range, and nearby lower elevations. Gusty winds and moderate rainfall were the main impacts from thunderstorm activity, with small hail mixing in with the strongest storms.

Flooding was not reported on Saturday. For rainfall estimates in your area, check out our State Precipitation Map below.

Click Here For Map Overview

The map below shows radar-estimated, rainfall gage-adjusted Quantitative Precipitation Estimates (QPE) across Colorado. The map is updated daily during the operational season (May 1 – Sep 30) by 11AM. The following six layers are currently available: 24-hour, 48-hour and 72-hour total precipitation, as well as maximum 1-hour, 2-hour and 6-hour precipitation over the past 24 hour period (to estimate where flash flooding may have occurred). The 24-hour, 48-hour and 72-hour total precipitation contain bias corrections that are not disaggregated into the hourly estimates, so there will likely be some differences. The accumulation ending time is 7AM of the date shown in the bottom right corner. Also shown optionally are vulnerable fire burn areas (post 2012), which are updated throughout the season to include new, vulnerable burn areas. The home button in the top left corner resets the map to the original zoom.