Issue Date: Monday, June 29th, 2020
Issue Time: 9:35AM MDT
Summary:
It was a hot one yesterday! High temperatures reach 100F over the plains, 90Fs over the lower elevations, and the mountain valleys reached the 80Fs. With the majority of the remaining moisture above the boundary layer, rain rates were not very efficient and storms produced more wind than rainfall. Afternoon storms over western Colorado (northwest corner, Northern/Central Mountains) generally produced only traceable amounts/cloud cover with isolated totals up to 0.10 inches near the Continental Divide. Surface gusts between 45 and 60 mph were recorded in the area on Sunday. A new fire was reported on Sunday around 1:15PM – Goose Creek Fire. The fire is located south of Lake Humphreys (Mineral County) and is burning in steep rugged terrain. It has currently burned 115 acres.
Storms over the Front Range had slightly higher moisture content, so isolated rainfall totals were between 0.10 and 0.25 inches for the stronger storms. The highest rainfall was recorded over Sedgwick and Phillips Counties where just under 0.50 inches fell; however, these storms also produced damaging 60 to 70 mph wind gusts. As anticipated, flooding was not reported on Sunday
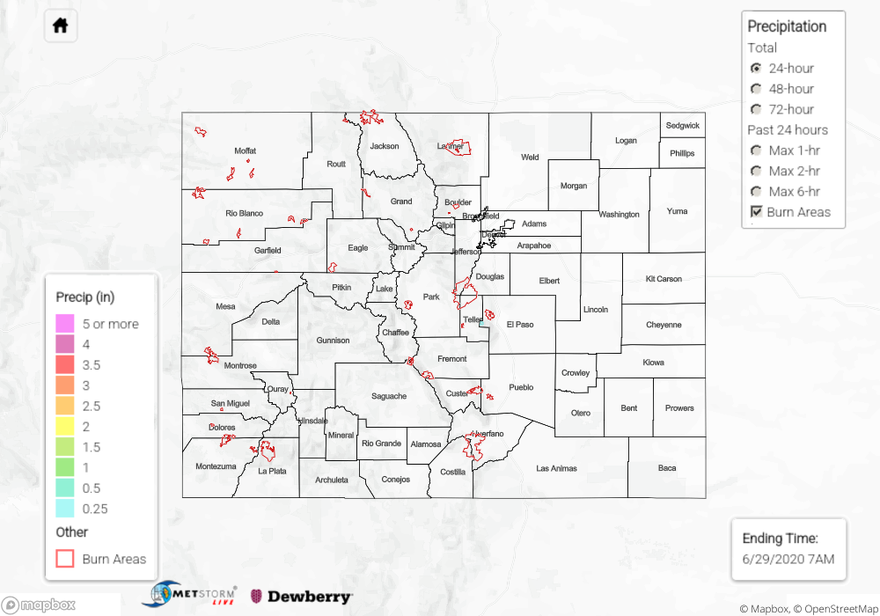
For precipitation estimates in your neighborhood over the last 24 to 72-hours, scroll down to the State Precipitation Map below.
Click Here For Map Overview
The map below shows radar-estimated, rainfall gage-adjusted Quantitative Precipitation Estimates (QPE) across Colorado. The map is updated daily during the operational season (May 1 – Sep 30) by 11AM. The following six layers are currently available: 24-hour, 48-hour and 72-hour total precipitation, as well as maximum 1-hour, 2-hour and 6-hour precipitation over the past 24 hour period (to estimate where flash flooding may have occurred). The 24-hour, 48-hour and 72-hour total precipitation contain bias corrections that are not disaggregated into the hourly estimates, so there will likely be some differences. The accumulation ending time is 7AM of the date shown in the bottom right corner. Also shown optionally are vulnerable fire burn areas (post 2012), which are updated throughout the season to include new, vulnerable burn areas. The home button in the top left corner resets the map to the original zoom.