Issue Date: Monday, July 22, 2019
Issue Time: 10:55AM MDT
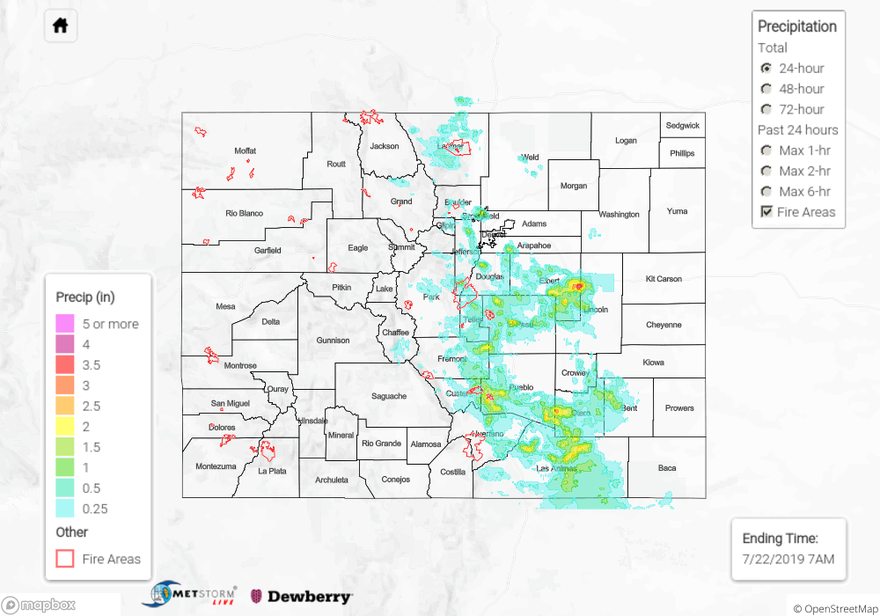
Summary:
Another day of severe thunderstorms and flash flooding over the Urban Corridor and Southeast Plains. Upslope flow of moist, warm air from the northeast provided lift for severe thunderstorms over the areas last night. Mixing out of surface moisture throughout the afternoon prevented afternoon convection over most areas, which reduced rainfall totals from forecasted values. However, a resurgence of moisture to the west due to a low level vorticity maximum over the San Luis Valley, provided energy and lift for severe storms beginning around 7pm. Notable severe weather reports to the NWS include:
Monument (El Paso County): Flash flooding with an estimated 6 inches of water on roadways
4 miles northeast of Colorado Springs (El Paso County): 1.5 inches of rain in 30 minutes
Arapahoe Park (Arapahoe County): 1.75 inch diameter hail
Beulah (Pueblo County): 3.1 inches heavy rain
Little to no rain was measured to the east of the Continental Divide, with the highest report of the day measuring 0.56 inches over Chaffee County. CoCoRaHS stations in Pueblo and El Paso counties reported up to 3.07 inches and 2.03 inches respectively. The river gage at Fountain Creek rose briefly into Action stage yesterday, raising 5 feet over 45 minutes!
Click Here For Map Overview