Issue date: Tuesday, July 16, 2019
Issue time: 10:40AM MDT
Summary:
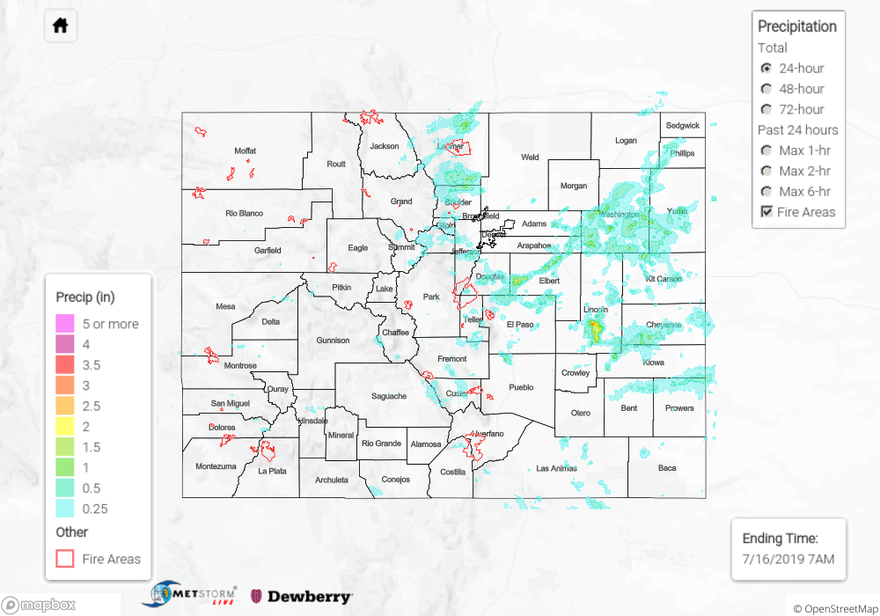
Severe thunderstorms where reported all along the Front Range and Urban Corridor yesterday as a shortwave passed overhead around 1PM. Moderate to high levels of surface moisture on the eastern plains were pulled westward throughout the morning to aid thunderstorm generation over the Palmer Ridge and high country east of the Continental Divide. West of the Continental Divide things dried out a bit compared to the weekend, as dry air gradually made its way in from the west-southwest. The main story yesterday was severe thunderstorms over the Urban Corridor and Palmer Ridge. Areal Flood Advisories were issued between 4PM and 6PM between Castle Rock and Colorado Springs, with radar derived measurements of 2.5 inches over the area over a 1.5 hour period. Another Areal Flood Advisory was issued over Lincoln County at 6:30PM, with radar deriving 3 inches of rain over a 75 minute period, which is a 1 in 100 year event! No flooding was reported over the areas. Other notable reports to the NWS include:
1.5 inch diameter hail: 5 miles N of Lyons (Larimer County)
1.25 inch diameter hail: 7 miles NE of Greenland (Douglas County)
60 mph wind gust: near Akron (Washington County)
Surface reports from CoCoRaHS measured 1.30 inches near Karval in Lincoln County, 1.12 inches of rain near Jamestown in Boulder County, 1.15 inches of rain near Akron in Washington County, and 1.03 inches of rain near Larkspur in Douglas County.
For a look at precipitation over your area, please visit the State Precipitation Map below.
Click Here For Map Overview
