Issue Date: Monday, July 15th, 2019
Issue Time: 9:40AM MDT
Summary:
The high pressure ridge remained intact on Sunday, which also controlled Saturday’s weather pattern as well. Flow turned more westerly, which allowed afternoon thunderstorm activity to spill into the adjacent plains and far eastern plains of Colorado. With high moisture still in place, some heavy rainfall was recorded with numerous Flash Flood Warnings and Areal Flood Advisories issued across the state.
Over western Colorado, totals were greatest over the San Juan Mountains and eastern Gunnison County. Highest radar estimated rainfall totals over these areas ranged from 0.50 to 1 inch. The Saint Elmo’s SNOTEL site recorded 1.4 inches for the 24-hour period. A Flood Advisory was issued for this storm, but as of this morning, there was no flooding reported. To the east, numerous CoCoRaHS stations just west of Fort Collins recorded rainfall just over 1 inch with the highest total at 1.23 inches for the 24-hour period. Deeper moisture over the Northeast Plains and slow steering winds allowed storms that formed on a SW to NE oriented boundary to drop 2 inches of rain at the cores of the storms. The storm that radar indicated dropped just over 2.5 inches in north, central El Paso County received a Flash Flood Warning around 4PM MDT. Again, flooding had not been reported to NWS as of this morning, but these were some impressive 1 to 2 hour totals associated with the PW surge.
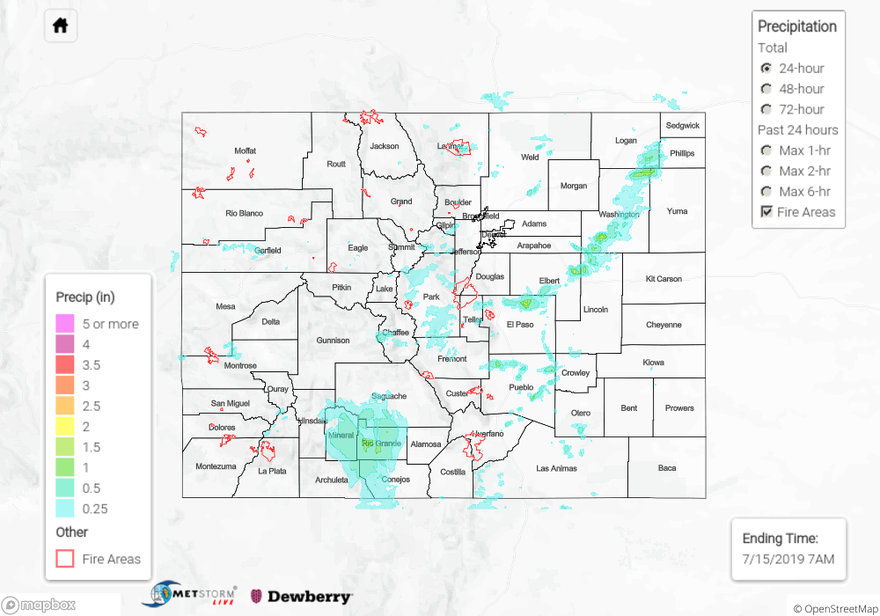
To see estimated precipitation totals over your neighborhood on Sunday, scroll down the State Precipitation Map below.
Click Here For Map Overview