Issue Date: Sunday, July 14th, 2019
Issue Time: 9:10 AM MDT
Summary:
High pressure aloft centered over the southern Rockies yesterday allowed high temperatures to climb to seasonally hot temperatures. Underneath the ridge of high pressure, southwest flow continued to transport good mid-level moisture into the state, which set the stage for a classic Colorado mid-summer thunderstorm day. Scattered storms got an earlier start over the mountains, kicking off by late-morning over the higher elevations. Most storms over the High Country produced light-to-moderate rainfall and gusty winds, but a stronger storm near Montrose produced a few severe reports: (1) 62 mph wind gust (2 miles NW of Montrose, (2) a tree blown over onto a car in Montrose, and (3) minor street flooding in Montrose.
East of the mountains it took a few more degrees of heating to spark activity, and isolated storms began around 1 PM. Initially, they produced light-to-moderate rainfall and gusty winds owing to a relative lack of moisture below cloud bases. However, as the day progressed, outflow boundaries from earlier storms moistened the near-surface layer, and allowed for a couple strong thunderstorms over the Denver metro during the evening, producing gusty winds, heavy rain, and hail. 1.0 inch diameter hail was reported 3 miles ENE of Broomfield, and 0.88 inch diameter hail was reported 2 miles SSW of Buckley AFB. The big story, though, was the heavy rainfall. Street flooding occurred across portions of Denver:
Highway 6 under Federal Boulevard
Intersection of W. Colfax Avenue and Raleigh Street
Iowa Avenue between Santa Fe Drive and Broadway
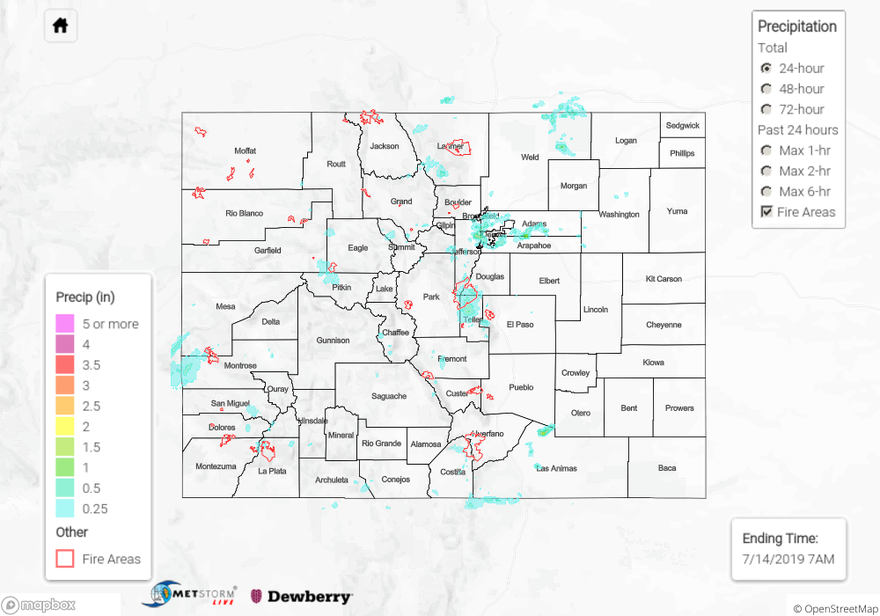
A few light rain showers were ongoing after sunrise this morning over portions of the Southwest Slope, San Juan Mountains, Grand Valley, and Central Mountains regions. For a look at precipitation estimates in your area, please see the State Precipitation Map below.
Click Here For Map Overview
The map below shows radar-estimated, rainfall gage-adjusted Quantitative Precipitation Estimates (QPE) across Colorado. The map is updated daily during the operational season (May 1 – Sep 30) by 11AM. The following six layers are currently available: 24-hour, 48-hour and 72-hour total precipitation, as well as maximum 1-hour, 2-hour and 6-hour precipitation over the past 24 hour period (to estimate where flash flooding may have occurred). The 24-hour, 48-hour and 72-hour total precipitation contain bias corrections that are not disaggregated into the hourly estimates, so there will likely be some differences. The accumulation ending time is 7AM of the date shown in the bottom right corner. Also shown optionally are vulnerable fire burn areas (post 2012), which are updated throughout the season to include new, vulnerable burn areas. The home button in the top left corner resets the map to the original zoom.