Issue Date: Sunday, July 7, 2019
Issue Time: 10:45AM MDT
Summary:
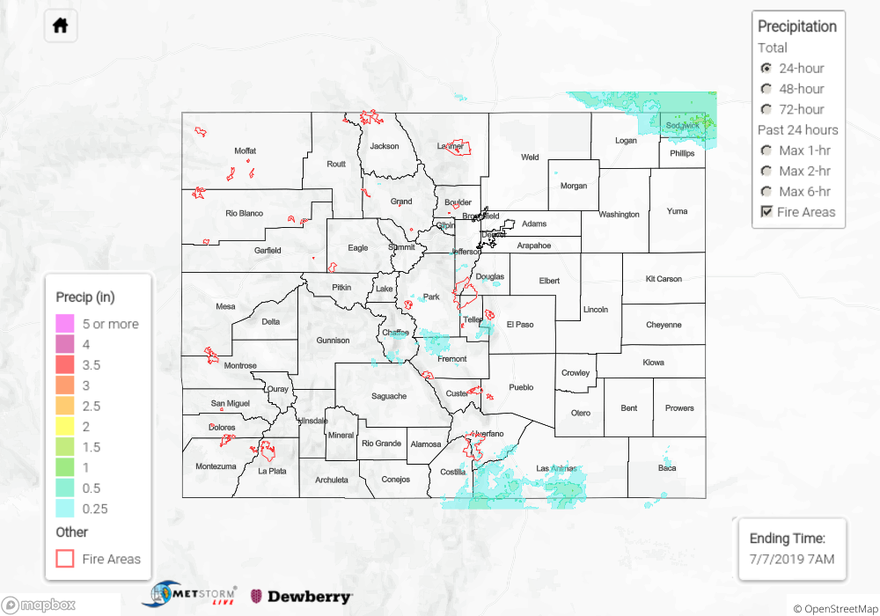
Brief afternoon thunderstorms formed over the Continental Divide yesterday as a shortwave passed over Colorado. Additional severe thunderstorms clipped the far northeast corner of the state along a stationary boundary late last night. Weak steering winds over the northern half of the state and high country prevented most storms from moving to the east off of the Divide. Moisture returned to the western half of the state after a mostly dry week, with maximum relative humidity measuring up to 95% over the San Juan Mountains and San Luis Valley. Precipitation remained light in most areas, with CoCoRaHS stations measuring between a trace and 0.2 inches. The far northeast corner measured the most rain for the day, with 1 inch measured in Sedgwick County. Downsloping winds off of the Southeast Mountains weakened moisture advection over the Raton Ridge, Southeast Plains, and Palmer Ridge, thus preventing rainfall over most of the area. Radar derived rain up to 0.5 inches over the Raton Ridge but CoCoRaHS stations only measured 0.27 inches.
Gages remain in action stage along the Arkansas River near La Junta and Avondale, the Blue River below Dillon, the Roaring Fork River near Aspen, and the Rio Grande River at Alamosa. Flows along these rivers remain high due to upstream dam releases. No flooding was reported yesterday.
For a look at precipitation estimates in your area, please see the State Precipitation Map below.
Click Here For Map Overview