Issue Date: Saturday, July 6, 2019
Issue Time: 9:30 AM MDT
Summary:
Severe thunderstorms were reported over the Urban Corridor, eastern plains, and Palmer Ridge yesterday as a shortwave passed over the state. Moisture levels remained high throughout the day, as a surface low pulled in moisture rich air from the Great Plains. Upslope flow over the Urban Corridor and Palmer Ridge caused storms to pick up and rapidly intensify around 3PM. Upper level steering winds were very weak, which allowed thunderstorms to linger over areas for quite some time, producing hail and heavy rain. Overnight a low level jet over the eastern plains provided dynamic forcing to maintain severe storms into the early morning. Rain gages from the UDFCD Alert network reported 1.79 inches in 2 hours near Longmont, and 1.06 inches in 2 hours near Boulder Municipal Airport. Large hail was reported the NWS throughout the Urban Corridor, with notable reports of 2.5 inch diameter hail in El Paso County near Black Forest and in Boulder County near Lafayette. Heavy rain was also reported to the NWS, with 0.61 inches in 15 minutes reported near Firestone in Weld County, and 2.36 inches in 90 minutes over Cheyenne County! Radar derived estimates up to 3.5 inches over Cheyenne County, and up to 2.5 inches in El Paso County.
No flash flooding was reported yesterday. The river gage on the Arkansas River near Avondale retreated to Action stage around 9PM last night. The gage along the Roaring Fork River near Aspen rose to Action stage early this morning due to snow melt throughout the week.
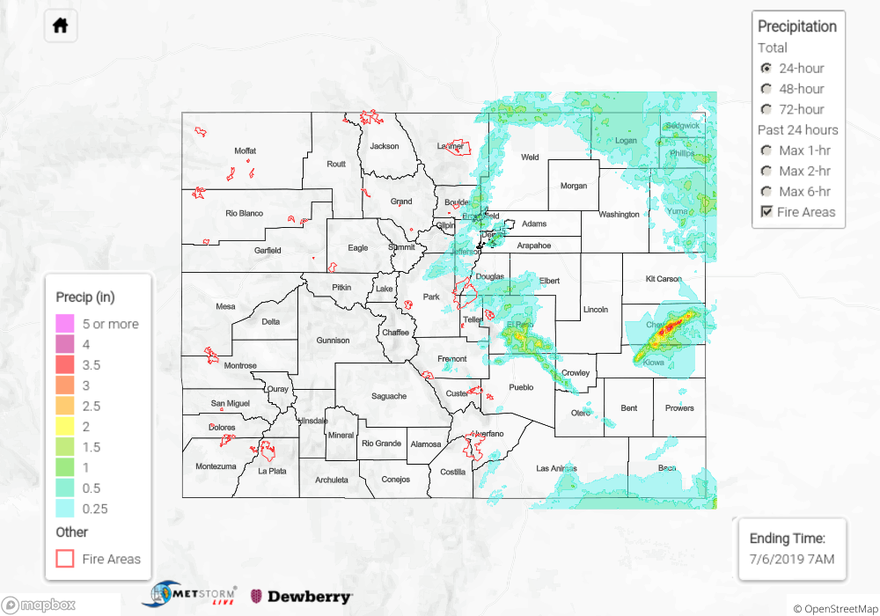
For a look at precipitation estimates in your area, please see the State Precipitation Map below.
Click Here For Map Overview